Garmin (GRMN) is by far the biggest player in the portable navigation device (PND) market - they have around 50% market share. A dominant position does not necessarily make for a good stock, however. Apparently Garmin's GPS devices are expected to be a hot seller for Christmas this year - not that I was aware people want GPS devices for Christmas - but will Garmin stock help add a little green to the tree? I doubt it because the stock is priced with outrageous expectations from analysts and investors. The risks are as follows:
-Selling prices will be under pressure as PNDs become increasingly commoditized, and this will significantly hurt the bottom line. Simply put, Garmin is getting more and more competition, and the effect is that gross margins have been falling constantly over the past few years. Once upon a time they were 57.7%, last quarter they were 48.7%... I consider this to be an irreversible trend the company will need to deal with, yet analyst models assume no further decline in selling prices (and hence gross margins). This is the opposite of what happens with technology, it gets cheaper over time - think about computers.
-Garmin has no recurring revenues. They only make money upon the purchase of their product, not beyond that. If you want a comparable company, think about Dell. Both make money on the purchase, and need their product to break/become useless before the customer buys another one. This is the exact opposite of what you want in a company. Other tech stocks have recurring revenues (think Apple's iTunes, or needing Research in Motion to give your Blackberry service), but Garmin only profits at the point of sale. This will be a significant problem for growing revenues and profits in the future.
-Valuation. GRMN is trading for 40x trailing annual free cash flow, or more than twice the expected growth rate from analysts (which I expect to be higher than will materialize). According to the DCF model, Garmin needs to grow FCF at 20% annually over the next 5 years, and still be able to justify a 30x FCF multiple to be even fairly valued (that means no upside from the current price of $50). I see little to no chance of such a scenario occurring, especially considering Point 1 about declining pricing power leading to lower selling prices.
Garmin is not a bad company. They are very good at what they do. The stock is simply too overhyped thanks to the "it has a cool gadget, the stock must be great" groupthink. I expect to see GRMN head toward $40, unless the entire premium gets wiped out and it goes to the $25-30 fair value range. Either way, I don't think its the kind of good, undervalued stock you want to be in.
One more reason...Garmin's latest holiday commercial now airing on various networks throughout North America.
Thursday, December 21, 2006
Wednesday, December 20, 2006
Akamai (AKAM)
Akamai (AKAM) is a company that provides content delivery network (cdn) services to enable websites to transmit data faster. Akamai was founded by an MIT professor and several of his grad students, went public during the tech bubble, and went from a high of $345 down to a low of 56 cents... quite a roller coaster. This year the stock is up 160%, having settled at $55 today.
Akamai's business performance is certainly been impressive. They have managed to grow revenues over the last several years at a clip of greater than 30%, and the bottom line growth has shown that they have excellent scale of their business model. My foremost concern with AKAM is that the analyst's consensus growth target for the next 5 years is 32%, meaning that Akamai will quadruple current income by the end of 2011. Possible? Maybe. Probable? No.
A worrisome indicator that Akamai might be slipping is Return on Capital (RoIC) numbers, which suggest that the company is losing something in terms of effectiveness - perhaps because Akamai is facing decent competition now, with the potential for much more in the future. Akamai relies on a proprietary algorithm (think Google for data transmission) which will lose protection in 2018, but there is no guarantee that some other person or company won't come along with a better method of execution. I think the operating risks for Akamai are significant, and the economic moat is narrow to non-existent. Few technology companies live up to expectations, not because they aren't good companies, but because there is a certain irrationality surrounding them... which brings us to the valuation of AKAM.
If Akamai grows its bottom line at the analyst-expected rate of 32% per annum, then the implied free cash flow exit multiple is 42x (AKAM currently trades at 90x ttm FCF), using a 12% discount factor and the current price of $55. Akamai needs to substantially exceed those targets in order to have any upside on the valuation, however, so keep in mind what the company is up against. For more conservative valuation purposes, I am going to assume they have some earnings misses, grow the bottom line around 25% per year (still exceptionally high), and justify and end FCF multiple of 30x. That scenario gives AKAM a fair value of $30/share, although leaving a sufficient margin of safety suggests holding off unless AKAM sees the low $20s.
I realize that alot of technology bulls will say that you can't value a firm like Akamai using old-economy DCF models, but following the cash eliminates much of the risk of buying stocks that do nothing but burn money and destroy value. In terms of industry and price, AKAM is clearly outside of my comfort level. I advise anyone considering investing in it to do their due diligence, and consider a research report released by Piper Jaffray, where they say that although the shares likely have some upside, they appear to be fully valued, if not overvalued... and that was written when AKAM was at $49.
Tuesday, December 12, 2006
Sun Microsystems release Java Standard Edition 6
Sun Microsystems has released the latest version of their Java development kit. This Java kit will make it easier for developers to mix JavaJava technology with other languages such as PHP, Python, Ruby and JavaScript. Sun's idea was to solve the developers problem of what is said "developers wanted to use other languages with the java. Until now the developers were not able to create this great mix application. Sun has created a collection of scripting engines on its Web site, and Java SE 6 includes a preconfigured version of Mozilla's open-source Rhino JavaScript engine.
"Java SE 6 is an extremely significant release for us," said Jean Elliott, Sun's senior director of Java platform product marketing. She drew particular attention to community participation in the platform's development. For the first time, hundreds of non-Sun developers had some input into the Java SE development process, beginning in September 2004 as Sun released Java SE 5.
Over two years in the making, Sun Microsystems is due to release the latest version of its Java Platform Standard Edition (Java SE) software Monday, placing particular emphasis on the application development platform's support for other scripting languages.
Java SE 6 comes with support for Microsoft's Windows Vista operating system, the business release of which made its debut late last month.
Friday, December 08, 2006
Yahoo's Panama Gives Semel Chance to Please Investors
By Jonathan Thaw
Dec. 7 (Bloomberg) -- Yahoo! Inc. Chief Executive Officer Terry Semel, having failed to appease investors with a management reshuffle, may get a second chance next year with new ad software designed to regain ground lost to Google Inc.
Known as Project Panama, the program is slated to be fully operational by March, three months behind schedule. The software, which marketers are starting to use, emulates Google and may help Yahoo generate more revenue from each Internet search.
Yahoo is releasing the new technology to spur sales and reverse a 32 percent slide in its stock price this year. As part of that effort, Semel this week reorganized Yahoo into three units and promoted Chief Financial Officer Susan Decker to oversee ad sales. Yahoo shares fell on concern that the changes may not be enough, prompting investors to look to Panama.
``While this technology might not allow Yahoo to overtake Google, it may help narrow the gap,'' said Scott Kessler, an analyst at Standard & Poor's in New York.
Panama improves the way Sunnyvale, California-based Yahoo displays Internet search ads and may generate an additional $115 million of sales in the second half of next year, Merrill Lynch & Co. analyst Justin Post said in a Nov. 30 note to investors.
Shares of Yahoo fell 23 cents to $26.63 at 4 p.m. in Nasdaq Stock Market composite trading.
Mark Cuban Buys read complete article...
Tuesday, December 05, 2006
A Great List of ETF 's
Standard Index Funds
QQQQ - NDX 100
SPY - SP500
DIA - Dow Jones Industrials
MDY - SP Mid Cap 400
IWM - Russell 2000
Short/Bear Funds (Allows you to short in IRA/401K accounts)
PSQ - Short QQQ Inverse of the NASDAQ-100
SH - Short S&P500 Inverse of the S&P 500
DOG - Short Dow30 Inverse of the DJIA
MYY - Short MidCap400 Inverse of the S&P Mid Cap 400
2x Margin Built In (Allows you to leverage IRA/401K)
QLD - Double the NASDAQ-100
SSO - Double the S&P 500
DDM - Double the DJIA
MVV - Double the S&P MidCap 400
QID - Double the inverse of the NASDAQ-100
SDS - Double the inverse of the S&P 500
DXD - Double the inverse of the DJIA
MZZ - Double the inverse of the S&P MidCap 400
Countries (Allows you to invest in other economies)
EWJ - Japan
EWT - Taiwan
EWH - Hong Kong
EWB - Brazil
EWU - UK
EWW - Mexico
EWM - Malaysia
EWS - Singapore
EWC - Canada
EWY - South Korea
EWP - Spain
EWA - Australia
EWP - Pacific ex. Japan
EWG - Germany
EWI - Italy
EWL - Switzerland
EWQ - France
EWD - Sweden
EWK - Belgium
EWO - Austria
EWN - Netherlands
Stock Market Sector Funds (Sector Baskets)
OIH - Oil Services Sector
XLE - Oil Sector
XLI - Industrial Sector
IGE - Natural Resources Sector
IYR - US Real Estate Sector
XLU - Utility Sector
SMH - Semiconductor Sector
XLF - Financial Sector
RTH - Retail Sector
TTH - Telecom Sector
WMH - Wireless Sector
SWH - Software Sector
XLK - Technology Sector
HHH - Internet Sector
XLB - Materials Sector
XLY - Consumer Discretionary Sector
PPH - Pharmaceuticals Sector
XLV - Health Care Sector
IGN - Networking Sector
BBH - Biotech Sector
Bond Funds
SHY - 1-3 yr treasury bond
IEF - 7-10 yr treasury bond
TLT - 20+ yr treasury bond
LQD - corporate bond
Commodities
GLD - Gold
SLV - Silver
USO - Oil
Currencies
FXA - Rydex CurrencyShares Australian Dollar Trust
ETF
FXB - Rydex CurrencyShares British Pound Sterling
ETF
FXC - Rydex CurrencyShares Canadian Dollar Trust ETF
FXE - Euro Currency Trust ETF
FXF - Rydex CurrencyShares Swiss Franc Trust ETF
FXM - Mexican Peso Trust ETF
FXS - Rydex CurrencyShares Swedish Krona Trust ETF
More information...
Monday, December 04, 2006
Omnivision (OVTI) is a fabless semiconductor company that focuses on designing imaging chips for (mainly) consumer electronics.
Omnivision (OVTI) is a fabless semiconductor company that focuses on designing imaging chips for (mainly) consumer electronics.
In the words of the company:
Its image-sensing devices, referred under the name CameraChips, are used to capture an image and used in various commercial and consumer mass-market applications. The CameraChips are used in various consumer applications, such as camera cell phones, digital still and video cameras, personal computer camera applications, and interactive video and digital toy cameras. In addition, CameraChips are integrated into security and surveillance products and analog toy cameras, automotive products, and medical imaging devices. Further, it designs and develops software drivers for various computer operating systems, as well as embedded operating systems.
OVTI is trading near $13.60 and has a market cap around $750 million, thanks to Friday's 16% plunge off an earnings report. Part of the reason attributed to the drop was fears about pricing pressures hurting margins. Contracting margins are pretty much implied whenever you talk about semis, and although OVTI has experienced that over the last several years earnings and cash flow have continued to grow at a rapid clip, with adjusted net income doubling and adjusted free cash flow tripling in the last three and a half years. Based off market cap., OVTI trades for 8.5x trailing earnings, and 8x trailing free cash flow. But market cap only tells half the story; as Omnivision has over $380 million in net cash, or about $7 per share - this means you are getting nearly half of your share price in cash. Now when you consider that Omnivision actually has an enterprise value of $360 million, the stock is actually trading for under 5x earnings and under 4x free cash flow... both of those numbers are phenomenal.
Just because OVTI appears dirt cheap doesn't mean its a bad company, on the contrary, it has generated nearly $100 million in annual free cash flow over the last few years. Omnivision also has developed a new chip that changes the way autofocusing is processed, which allows for much quicker and clearer imaging. The all-digital process has the potential to eliminate any sort of manual focusing traditionally done with cameras, and I'm fairly sure that somewhere in my research I read that Omnivision has patentied the technology, which should be ready for commercial use within a few quarters. The company's expansion in security and medical imaging is also offering growth opportunities beyond the consumer electronics market of cameraphones and video recorders, so there is plenty of potential growth on top of that excellent financial footing.
Running a quick revenue and earnings projection concludes that top line growth of 15% over the next 5 years is manageable, with net income growing about 17% over that time period. The lastest consensus estimate from Wall Street was 20%, but I think you are going to see some waffling because of the quarterly disappointment... and I like to be conservative.
According to the valuation model, OVTI is priced for no free cash flow growth over the next five years, and has a terminal valuation of 5x FCF. Recall that OVTI is trading for just under 8x FCF right now... which I believe is extremely cheap in itself. But anyways, from the reverse engineering standpoint, OVTI is priced as being a company that will see no more growth, and will end up being valued at a 20% free cash flow yield. Think those pricing assumptions give you some margin of safety?
On the more realistic (but still conservative) side of pricing, lets assume that Omnivision manages to grow free cash flow at about 10% per year, or about 60% of what is forecast by a quick growth projection (I choose 60% because that leaves a 20% margin of safety and 20% for "excess return"). At 10% growth, and an end cash flow yield of about 15% (which matches the steep 15% discount rate I am applying to account for riskiness), OVTI appears to be an $18-19 stock, which would give an appreciation of about 35%.
If we increase our assumptions about the growth rate for Omnivision to 12%, and allow for an exit multiple of 8x FCF, a 15% discount rate results in OVTI being valued around $21, or a potential 50% gainer. I would argue, however, that OVTI's recent sharp drop coupled with the huge cash position makes OVTI less of a risk now, and worthy of a lower discount rate - 12% for the discount makes OVTI appear to be 75% undervalued. Basically, its hard to justify this stock going much lower, and very easy to see this one running up toward $20.
One additional fact to note is that Omnivision does an exceptional job at creating value from invested capital; EBIT RoIC was 100% over the last four quarters. Although RoIC has been slipping slightly on a sequential basis, taking a slightly longer term time frame sees free cash flow RoIC climbing from 28% three years ago to over 75% today. This means, in simple terms, that for each dollar Omnivision has invested in its business today, it returns 75 cents in cash after everything else is accounted and paid for. Omnivision hasn't been skimping on spending for the future either; outlays for Research and Development and Capital Expenditures continue to increase, and as long as Omnivision can continue generating such high returns on capital, it looks to be well positioned to continue growing its bottom line.
Final thoughts: I think its a strong buy in the mid-$13s where it is now. If it goes lower, that just makes it look even more attractive.
Thursday, November 30, 2006
Learn a Major Key of Cutting Your Losses Early!
One major importance while investing (including professionals) is cutting your losses early and before your in the whole complete. One problem can be not spending enough time to research and critically thinking through investments risks. To many times I see people spending all kinds of time of planning for the winning stock thats going to hit a grand slam for them. But they don't even think once about how or what percentage do we sell and take our losses or winnings.
The Factors that Really Drive Investors
People really are inconsistent in the thinking of investment risks. People think this is just a given with all the information out there...and you just have to find the low investment risks and find the highest return. Though, our studies show us something completely different.
Though, it's the way you view and look at things is a major key in this investing ideas of cutting your losses early. You must really start thinking about or driven by is it actually investing risk? Though, through our finding we have came to understand it's actually the loss. So now, your asking well what's the difference? Great questions and let us answer this question.
Here is an good example, you have to investment choices:
* Scenerio one: 80% potential of winning $4,000 versus a 20% potential of earning nothing
* Scenerio two: 100% potential of receiving $3,000.
Now to many this is a no brainer right of what you would choose? While the scenerio one is pontentially the better investment (with a pontential "expectation" of $3,200), 80% of people choose the scenerio two the 100% money. This means, they aren't willing to risk a small investment profit for a potentially bigger one.
Now let's look at the investment scenerios from a loss perspective, with the same scenerios:
* 80% pontential of losing $4,000 versus a 20% chance of breaking even, or
* 100% pontential of losing $3,000.
Now look at this closely, believe or not over 92% of people choose the first scenerio. They are willing to take this investment. This means, that 92% of the people will do just about anything to avoid an investment loss. When the investments involve losing money, 92% of us are risk-seekers, not risk reluctant.
Now we hope we have opened some eyes with this little example and investment scenerio. Also we hope to show you that a lot of us are not as consistent in our thinking in considering investment risks. And this kind of thinking can really come back to hurt you in your investments.
Investing lossess cut early...remember a major key or the golden rule
A major key or golden rule on investing is to "cut your losses early, short, and let your winners ride." Almost every successful investor in the world has his discipline and sticks by this rule - however, please not as well there are very few successful investors who regularly beat the markets. For the rest of us average joes (about 99% of investors) following this major key or golden rule seems too difficult. Look at what Peter Bernstein says in Against the Gods: The Remarkable Story of Risk, "It is not so much that people hate uncertainty - but rather, they hate losing... A loss taken is an acknowledgement of error." That says it better then we could.
It's major key or golden rule is not just for the stock market. It's in all of life. Check out this example of investment risk, from Peter Bernstein...
* "Imagine that a rare disease is breaking out and is expected to kill 600 people. Two different programs are available to deal with the threat. If Program A is adopted, 200 people will be saved. If Program B is adopted there is a 33% probability that everyone will be saved and a 67% probability that no one will be saved.
* "Which program would you choose? If most of us are risk-averse, rational people will prefer Plan A's certainty of saving 200 lives over Plan B's gamble, which has the same mathematical expectancy but involves taking the risk of a 67% chance that everyone will die. [When given the choice], 72% of people chose the risk-averse response represented by Program A."
* "Now consider the identical problem posed differently. If Program C is adopted, 400 of the 600 people will die, while Program D entails a 33% probability that no one will die and a 67% probability that 600 people will die. Note that the first of the two choices is now expressed as 400 deaths rather than 200 survivors, while the second program offers a 33% chance that no one will die. ...78% of people quizzed were risk seekers and opted for the gamble: they could not tolerate the prospect of the sure loss of 400 lives."
Why Avoiding Hugh Investment Losses Is Key to Your Strategy
We, as investors, have to understand that we are not always going to know it all. What we are going to lose or gain. We need to be in the position whereby we are avoiding investment losses as much as possible. However, first, if we are to succeed in investing and stock market, we must learn to take cut our investment losses early. And this is because a small loss can't be allowed to become a BIG loss.
Smart investors come to understand the need to go against what most of the time feels natural. And that means learning to cut investment losses early, and learning to let winners ride. Put simply, the way you make money is to combine a few small losses with big winners.
In order to win the war on the street, you've got to learn to cut your losses. You need to man up and admit you're wrong.. That means recognizing the potential nature of human instinct and cut investment losses. And it means cutting your investment losses early before they can become big losses. It's never to late to start good discipline, especially in the investing!
Happy Holiday Investing!!
Investing Focus
www.investingfocus.com
"Your Start to a Future Financial Gain"
China Technology Announced Proposed Annual Meeting of Shareholders and Substantial Shareholder Restructuring
HONG KONG, Nov. 30 /Xinhua-PRNewswire-FirstCall/ -- China Technology Development Group Corporation CTDC ("CTDC" or "the Company") today announced the Company's Board of Directors ("the Board") convened a meeting attended by all board members on November 27, 2006. The Board reviewed and unanimously agreed that the 2006 Annual General Meeting of the shareholders (the "Annual Meeting") will be held on December 22 and the close of business on November 28, 2006, New York time, has been fixed as the record date of the Annual Meeting.
The Board also reviewed, approved and proposed for submission to the shareholders during the Annual Meeting, transactions involving the change of substantial shareholders through the sale of outstanding shares by existing substantial shareholders, and issuance of new shares and warrants for the purchase of new shares, by the Company to new investors (the "Proposed Transactions").
A full version of the notice of the Annual Meeting and the shareholders' circular are filed in Form 6-K together with copies of the executed agreements in connection with the Proposed Transactions, which is available at http://www.nasdaq.com/asp/quotes_sec.asp?selected=CTDC&symbol=CTDC .
About CTDC:
CTDC is engaged in information network security and nutraceutical business in the People's Republic of China. CTDC's existing major shareholder is Beijing Holdings Limited, a conglomerate with over $3 billion in total assets beneficially owned by the Beijing People's Municipal Government. For more information, please visit our website at www.chinactdc.com .
Forward-Looking Statement Disclosure
This press release of the Company, which is a foreign private issuer, on Form 6-K contains forward-looking statements within the meaning of Section 27A of the Securities Act of 1933, and Section 21E of the Securities Act of 1934. These statements relate to future events or the Company's future financial performance. The Company has attempted to identify forward-looking statements by terminology including "anticipates", "believes", "expects", "can", "continue", "could", "estimates", "expects", "intends", "may", "plans", "potential", "predict", "should", or "will" or the negative of these terms or other comparable terminology. These statements are only predictions, uncertainties and other factors may cause the Company's actual results, level of activity, performance or achievements to be materially different from any future results, level of activity, performance or achievements expressed or implied by these forward-looking statements. The information in this Report on Form 6-K is not intended to project future performance of the Company. Although the Company believes that the expectations reflected in the forward- looking statements are reasonable, the Company does not guarantee future results, level of activity, performance or achievements. The Company's expectations are as of the date this Form 6-K is filed, and the Company does not intend to update any of the forward-looking statements after the date this Report on Form 6-K is filed to conform these statements to actual results, unless required by law.
Contact:
China Technology Development Group Corporation
Michael Siu, Executive Director, Chief Financial Officer and Secretary
Tel: +852-3112-8461
Email: investor.relations@chinactdc.com
michael.siu@chinactdc.com
Copyright 2006 PRNewswire
Third Wave Announces Launch of Universal Invader(R) Program
Third Wave Announces Launch of Universal Invader(R) Program
Stocks mentioned in this article
Third Wave Technologies, Inc. (TWTI) Stock Quote, Chart, News
ORLANDO, Fla.,-- Third Wave Technologies Inc. TWTI today announced the launch of its Universal Invader(R) Program, which allows customers to design, build and optimize their own Invader(R) chemistry-based assays.
"Third Wave is pleased to open access to our Invader(R) chemistry, making an already simple, flexible chemistry even easier for customers to use," said Kevin T. Conroy, president and chief executive of Third Wave. "The Universal Invader(R) Program enables Third Wave to better serve our customers by providing them the flexibility to develop tests that meet their specific needs and interests, outside of our standard menu of products."
The program includes web-based Universal Invader(R) design software. The software generates the designs for all oligonucleotides, or DNA probes, needed for customers to build Invader(R) chemistry-based reactions for their specific DNA targets of interest in their own laboratories. Participants in the Universal Invader(R) Program can purchase their design-specific oligonucleotides from a third-party vendor and general purpose reagents, including Third Wave's Cleavase(R) enzyme, directly from the company.
The program utilizes the Third Wave's Invader Plus(R) chemistry, which combines the accuracy and specificity of its Invader(R) chemistry with the sensitivity of PCR sample amplification. Customers can use the Invader Plus(R) chemistry without paying any royalty because the relevant PCR patents expired last year. For more information about the Universal Invader(R) Program, please visit http://www.universalinvader.com .
About Third Wave Technologies
Third Wave develops and markets molecular diagnostic reagents for a variety of DNA and RNA analysis applications to meet the needs of our customers. The company offers a number of products based on its Invader(R) chemistry for clinical testing. Third Wave offers in vitro diagnostic kits, and analyte specific, general purpose, and research use only reagents for nucleic acid analysis. For more information about Third Wave and its products, please visit the company's website at http://www.twt.com .
All statements in this news release that are not historical are forward-looking statements within the meaning of the Securities Exchange Act of 1934 as amended. Such forward-looking statements are subject to factors that could cause actual results to differ materially for Third Wave from those projected. Those factors include risks and uncertainties relating to technological approaches of Third Wave and its competitors, product development, manufacturing, market acceptance, cost and pricing of Third Wave products, dependence on collaborative partners and commercial customers, successful performance under collaborative and commercial agreements, competition, the strength of the Third Wave intellectual property, the intellectual property of others and other risk factors identified in the documents Third Wave has filed, or will file, with the Securities and Exchange Commission. Copies of the Third Wave filings with the SEC may be obtained from the SEC Internet site at http://www.sec.gov . Third Wave expressly disclaims any obligation or undertaking to release publicly any updates or revisions to any forward-looking statements contained herein to reflect any change in Third Wave's expectations with regard thereto or any change in events, conditions, or circumstances on which any such statements are based. Third Wave Technologies, Invader and the Third Wave logo are trademarks of Third Wave Technologies, Inc.
Tuesday, November 28, 2006
Tis the Season to be shopping!
After a crazy jammed backed weekend of shopping, discounts, giveaways, toys, and so much more! Tis the season, and it's time for all the shoppers to be clicking onto their computers for the later part of finishing up shopping.
It seems to be more competive as ever online this year while more and more companies offering free shipping, more discounts, other great offers this christmas gift giving season.
The tread of shopping online on the Monday after Thanksgiving is growing so big and calling it "Cyber Monday" by many National Retail Federation. Retailers like Circuit City Stores Inc. are stepping up to the plate on "Cyber Monday" by offered special one-day coupons. While, Walmart.com began the fight on Monday offering a five-day special on such online-only items as big as some flat-screen TVs.
To even throw more joy into the season and Cyber Monday, the National Retail Fed. launched a website called CyberMonday.com, where the idea is to pull all the online discounts targeting the cyber monday and through the holiday season from nearly 400 retailers. And the early reports are showing that all the christmas incentives seem to be working.
Meany retailers are already reporting as high as 60 percent increase in website traffic and an 80 percent increase in online sales through noon Monday.
Though the first Monday after Thanksgiving starts the Christmas shopping online season, its reported it will not be the busiest day for retailers. Internet research firm comScore Networks Inc. is predicting the days to come and specificially either Dec. 11 or Dec. 12, making Cyber Monday either the ninth or tenth busiest online shopping day. Last year, the first Monday after Thanksgiving was the ninth busiest day.
Still, Cyber Monday is marking the Christmas shopping season for many merchants for this Holiday season.
As for online holiday sales growth, JupiterResearch forecasts an 18 percent increase for online sales to $32 billion. That is slightly below the 23 percent pace in the previous year.
Analysts are carefully monitoring the rivalry between online-only stores and brick and mortar stores, which are overtaking the lead in the online market share wars. According to comScore, from 2003 to 2005, sales growth for brick and mortar stores' online divisions grew twice the rate of that of online-only merchants.
Stores that operate both e-commerce sites and physical stores are realizing they can "use the Internet to not only sell product but also drive traffic to their stores, " said Gian Fulgoni, chairman of comScore Networks.
Consumer electronics retailer Circuit City offered special coupons just for Monday, including additional savings of $100 on TV purchases of $1,700 and up, as well as an additional $50 savings on home audio systems purchases of $400 and up.
Throughout the holiday season, Circuit City is giving $24 gift cards to customers if their online order is not ready for pick up at the stores in 24 minutes.
Walmart.com, which redesigned its Web site earlier in November, unveiled Monday 50 online only specials offers, from cashere scarves to flat-panel plasma TVs, that will be available through Dec. 1. Carter Cast, CEO of walmart.com, said it will be replacing sold-out items with new offers this week.
Among the most popular items Monday on walmart.com were $289 GPS units by Garmin and 3 megapixel digital cameras by Philips.
The pure online players are fighting back with free shipping and other deals.
Online retailer Amazon.com pushed shoppers to get started early by holding an ongoing poll to select one steeply discounted gift item to be offered in limited supplies beginning on Thanksgiving day, on top of other deals.
Online jewelry retailer Bluenile.com is offering for the first time free overnight shipping to its best customers, a program that will run through Valentine's Day. It also sent out e-mails Monday offering 10 percent discounts to customers through Dec. 7.
Online closeout retailer Overstock.com for the first time offered free shipping offers, which started Thanksgiving Day and ends Tuesday, according to Patrick Byrne, CEO of Overstock.com.
"We're all competing on shipping promotions," Byrne said.
Wednesday, November 22, 2006
China Yingxia Reports Third Quarter Revenues
China Yingxia International, Inc. (OTCBB: CYXI), a developer and manufacturer of health food products in China, today announced that revenue in the third quarter ended September 30, 2006 was $1,857,392 and net income from operations was $742,251. Net income for the quarter including a provision for income taxes was up 349% to $2,958,786 compared with $659,645 in the third quarter of 2005.
Revenue for the nine months ended September 30 of 2006 totaled $5,308,352, up $1,095,196, or approximately 26%, compared to revenue of $4,213,156 in the comparable nine-month period a year earlier. For the nine months ended September 30 of 2006, the company reported net income of $4,668,569, or $0.14 per fully diluted share, an increase of $3,255,283, or approximately 230%, from the comparable nine-month period of 2005.
Ms. Yingxia Jiao, CEO and chairman of CYXI, said, "The strong increase in revenue was attributable to the successful expansion of our product lines and sales network to meet the needs of existing and new customers. Despite achieving lower sales totals for the three-month period of this quarter, we were able to record higher earnings as a result of the partial operating of our soybean product manufacturing lines. Additionally, we were granted the status of a Foreign-Invested Enterprise ('FIE') as we became wholly owned by an U.S. public company during the period ended September 30, 2006. In accordance with applicable Chinese Law, the Company is therefore eligible for an exemption of income tax in PRC for the first two profitable years and a 50% income tax reduction for the next three years. The income tax exemption and reduction can be applied retroactively. In our case, this exemption is applied to fiscal years 2004 and 2005. As result of this change, the Company recognized a total of $2,216,535 as income tax benefit in this period."
About China Yingxia International, Inc.
China Yingxia International, Inc., through its 100%-owned subsidiary, Harbin Yingxia Industrial Group Co., Ltd. ("Yingxia"), is primarily engaged in the development, production and sales of health food products in China. Yingxia is located in the Province of Heilongjiang in mainland China, and it currently has over 180 employees and 3 agricultural production bases. Yingxia's products include fresh cactus and cactus dry power, organic soybean, and Longgu golden rice. Yingxia is currently implementing an aggressive expansion plan which includes the construction of a new production facility of 16,300 square meters. For the year ending 12/31/2005 the Company achieved $6.1 million in sales with a net income of $1.8 million, with $13.3 million in net assets.
For more information about China Yingxia International, Inc. (OTCBB: CYXI), please visit: http://www.Chinayingxia.com.
Safe Harbor Statement under the Private Securities Litigation Reform Act of 1995
This news release contains forward-looking statements within the meaning of the "safe harbor" provisions of the Private Securities Litigation Reform Act of 1995, may involve risks, uncertainties and other factors that may cause the company's actual results to be materially different from any future results or performance suggested by the forward-looking statements in this release. These risks and uncertainties include, without limitation, risks that the results of future performance will not be consistent with the forward-looking statements. We undertake no obligation to revise or update publicly any forward-looking statements.
Source: Market Wire (November 22, 2006)
Coral Gold Resources President Louis Wolfin Featured in An Audio Interview On Yahoo Finance Small Cap Centre
TORONTO, Nov. 22, 2006 (PRIMEZONE) -- AGORACOM Investor Relations Corp. ("AGORACOM") (www.agoracom.com), is pleased to announce that Coral Gold Resources Ltd. (OTCBB:CGREF) (TSX-V:CGR) (Berlin:GV8) (Frankfurt:GV8) Founder and President Mr. Louis Wolfin, was recently interviewed by the Yahoo! Small Cap Centre (finance.yahoo.ca)
Mr. Wolfin discusses a wide range of topics including the Company's portfolio of strategically located claim blocks along the Battle Mountain-Eureka gold trend in north-central Nevada, the latest drill results and future prospects and initiatives.
The Yahoo! Finance Canada Small Cap Centre focuses specifically on emerging small cap companies. The Yahoo! Small Cap Centre caters to an audience of small cap investors that are in search of exciting and compelling information within the small cap realm.
To access the Small Cap Centre -- Powered By AGORACOM, please visit Yahoo! Finance Canada at http://ca.finance.yahoo.com and scroll through the middle column.
Alternatively, to access the interview page directly, please click on the link below.
http://cosmos.bcst.yahoo.com/scp_v3/viewer/index.php?pid=16390&rn=222561&cl=1237543
For all future Coral Gold investor relations needs, investors are asked to visit the Coral Gold IR hub at www.agoracom.com/IR/coralgold where they can post questions and receive answers within the same day, or simply review questions and answers posted by other investors. Alternatively, investors are able to e-mail all questions and correspondence to CGR@agoracom.com where they can also request addition to the investor e-mail list to receive all future press releases and updates in real time.
About Coral Gold Resources Ltd.
Coral Gold has been exploring a portfolio of strategically located claim blocks along the Battle Mountain-Eureka/Cortez gold trend in north-central Nevada. These properties are situated in the active Crescent Valley region, adjoining the large Cortez (Pipeline) gold mine.
To find out more about Coral Gold Resources Ltd. (TSX-V:CGR) (OTCBB:CGREF) (Berlin:GV8) (Frankfurt:GV8), visit our website at www.coralgold.com
About AGORACOM Investor Relations Corp. (www.agoracom.com) (www.agoraIR.com)
AGORACOM Investor Relations Corp. (AGORACOM) is North America's leading outsourced investor relations firm for small-cap companies. AGORACOM's exclusive IR HUB delivers two-way investor relations and communications, providing 100% transparency accessibility.
The AGORACOM Investor Relations logo is available at http://www.primezone.com/newsroom/prs/?pkgid=2200
Safe Harbor Statement:
Statements included in this news release, which are not historical in nature, are intended to be, and are hereby identified as "Forward-Looking Statements" for purposes of safe harbor provided by Section 21E of the Securities Exchange Act of 1934, as amended. Forward-Looking Statements may be identified by words including "anticipate," "await," envision," "foresee," "aim at," "plans," "believe," "intends," "estimates" "expects" and "projects" including without limitation, those relating to the company's future business prospects, and are subject to certain risks and uncertainties that could cause actual results to differ materially from those indicated in the Forward-Looking Statements. Readers are directed to the company's filings with the U.S. Securities and Exchange Commission for additional information and a presentation of the risks and uncertainties that may affect the company's business and results of operations. www.sec.gov.
CONTACT: Coral Gold Resources Ltd.
Louis Wolfin, Director
(604) 682-3701
ir@coralgold.com
www.coralgold.com
AGORACOM Investor Relations
Investor Relations
CGR@Agoracom.com
www.agoracom.com/IR/CoralGold
Source: PrimeZone (November 22, 2006 - 10:35 AM EST)
News by QuoteMedia
www.quotemedia.com
Tuesday, November 21, 2006
Google (goog) is pumped up over $500
Google Inc.'s (goog) stock price surpassed $500 for the first time Tuesday, marking another milestone in a rapid rise that has catapulted the Internet search leader into the corporate elite.
The GOOG stock symbol just keeps driving it's way up the market! It's even now reaching the 507 mark just minutes ago in trading.
Google is now valued at right around $154 billion just eight years after former Stanford University graduate students Larry Page and Sergey Brin started the business in a Silicon Valley garage.
The Mountain View-based company is now Silicon Valley's most valuable business, eclipsing the likes of Intel Corp., the world's largest computer chip maker, and Hewlett-Packard Co., a high-tech pioneer that also famously started in a garage 67 years ago.
Google's remarkable success has minted Page and Brin, both 33, as multibillionaires along with their hand-picked chief executive, Eric Schmidt.
Hundreds of other Google employees are millionaires because so many investors want to own a piece of a company that has become the Internet's most powerful financial force while building a brand so ingrained in society that it has become part of the English language.
It took slightly more than a year for Google's shares to travel from $400 to $500 -- the stock's longest journey from one major milestone to the next since the company priced its initial public offering at $85 in August 2004.
The shares topped $100 on their first day of trading on the Nasdaq Stock Market, then crossed $200 in less than three months. The stock broke through $300 another seven months later in June 2005 and then breached $400 on Nov. 17 last year.
The latest spurt of optimism appeared to reflect a belief that Google will quickly introduce ways to mine more online advertising revenue from its just-completed $1.65 billion acquisition of YouTube Inc. Google used its stock to finance the deal.
Google currently has made most of its money selling brief, written ads that are posted alongside search results and other online content, but management believes it can mine even bigger profits by expanding into video and delivering more messages to mobile computing devices.
Management also wants to extend Google's advertising clout beyond the Web. The company is currently testing a program to place ads in 50 of the nation's largest newspapers and hopes to begin distributing radio ads by the end of this year.
Those grand ambitions are one of the reasons that Google shares keep climbing. The run-up makes Google's stock look fairly expensive by one widely used barometer known as the price-to-earnings, or p/e, multiple.
Analysts, on average, predict Google will earn $13.70 per share next year, leaving the company's p/e at about 37. By comparison, the p/e of Microsoft Corp. -- the world's most prized technology company with a market value of nearly $300 billion -- is about 21, based on analyst's 2007 earnings projections.
Google's relatively high p/e hasn't fazed several analysts who have already predicted the company's stock price will hit $600 within the next year.
Betting against Google has proven to be foolish so far. In the months leading to Google's IPO, widespread skepticism about the company's growth prospects prompted management to discount its desired price, enriching investors who were able to buy at $85. And just eight months ago, Google shares dropped as low as $331.55 amid fears that the company's earnings growth might be on the verge of a dramatic slowdown.
Anyone waiting for a stock split before investing in Google risks being left on the sidelines. Although most publicly held companies regularly split their stock to create a lower per-share price that appeals to more Main Street investors, the proudly unconventional Page and Brin have repeatedly indicated they have no intention of resorting to that maneuver.
Saturday, November 11, 2006
Ex Dividend Date answer, Stock Dividend Question
When a company decides to pay out in what is called a dividend, it sets a date for the record of when you must be on the company's books as a shareholder to receive the dividend. This date is also used for the company to determine who is sent the company information such as financial reports, sent proxy statements, and other information.
Once the company sets the record date, the stock exchanges or the National Association of Securities Dealers, Inc. fix the ex-dividend date. The ex-dividend date is normally set for stocks two business days before the record date. If you purchase a stock on its ex-dividend date or after, you will not receive the next dividend payment. Instead, the seller gets the dividend. If you purchase before the ex-dividend date, you get the dividend.
Once the company sets the record date, the stock exchanges or the National Association of Securities Dealers, Inc. fix the ex-dividend date. The ex-dividend date is normally set for stocks two business days before the record date. If you purchase a stock on its ex-dividend date or after, you will not receive the next dividend payment. Instead, the seller gets the dividend. If you purchase before the ex-dividend date, you get the dividend.
Wednesday, November 08, 2006
Almost Family, Inc. (AFAM)
Almost Family, Inc. (AFAM)
Almost Family, Inc. and its subsidiaries provide home health nursing services. It operates through two segments Visiting Nurse and Personal Care. The Visiting Nurse segment provides medical services in patients' homes. The Personal Care segment provides personal care services in patients' homes. The company has service locations in Kentucky, Florida, Maryland, Ohio, Connecticut, Massachusetts, Alabama, and Indiana. Almost Family was formerly known as Caretenders HealthCorp and changed its name to Almost Family, Inc. in 2000. The company was incorporated in 1985 and is based in Louisville, Kentucky.
The few things I like about this one is the low P/E, and honestly, it's has the lowest out of all it's direct competitors. Through on top of that it has a Qtrly Rev Growth (yoy) of 13.80% and still going!
The only thing that we can not figure out is that. Someone is behind all this, because for all the numbers and key stats. I mean it's a great story, good solid numbers, but is just stuck. We just can not understand why this one has not taken off yet. Though, we feel that it could somewhere down the road. AFAM might be one to watch!
Friday, November 03, 2006
Stock Market Guarantee
Stock Market Guarantee
Helium is up.
Feathers were down.
Paper was stationary.
Fluorescent tubing was dimmed in light trading.
Knives were up sharply.
Cows steered into a bull market.
Pencils lost a few points.
Hiking equipment was trailing.
Elevators rose, while escalators continued their slow decline.
Weights were up in heavy trading.
Light switches were off.
Mining equipment hit rock bottom.
Diapers remained unchanged.
Shipping lines stayed at an even keel.
The market for raisins dried up.
Coca-Cola fizzled.
Caterpillar stock inched up a bit.
Sun peaked at midday.
Balloon prices were inflated.
Scott Tissue touched a new bottom.
And batteries exploded in an attempt to recharge the market.
Wednesday, November 01, 2006
Value of Time - this will help you value life, time, friends, family and etc! What's it really worth to you?
Value of Time - this will help you value not stocks or money but may it help you think about life, time, friends, family and etc! What's it really worth to you?
Imagine there is a bank that credits your account each morning with $86,400.
It carries over no balance from day to day.
Every evening deletes whatever part of the balance you failed to use
during the day.
What would you do? Draw out every cent, of course!
Each of us has such a bank. Its name is TIME.
Every morning, it credits you with 86,400 seconds.
Every night it writes off, as lost, whatever of this you have failed
to invest to good purpose.
It carries over no balance.
It allows no overdraft.
Each day it opens a new account for you.
Each night it burns the remains of the day.
If you fail to use the day's deposits, the loss is yours.
There is no going back. There is no drawing against the "tomorrow".
You must live in the present on today's deposits.
Invest it so as to get from it the utmost in health, happiness and success!
The clock is running. Make the most of today.
To realize the value of ONE YEAR, ask a student who failed a grade.
To realize the value of ONE MONTH, ask a mother who gave birth to a
pre-mature baby.
To realize the value of ONE WEEK, ask the editor of a weekly newspaper.
To realize the value of ONE DAY, ask a daily wage laborer with kids to feed.
To realize the value of ONE HOUR, ask the lovers who are waiting to meet.
To realize the value of ONE MINUTE, ask a person who missed the train.
To realize the value of ONE SECOND, ask a person who just avoided an accident.
To realize the value of ONE MILLI-SECOND, ask the person who won a
silver medal in the Olympics.
Treasure every moment that you have! And treasure it more because you
shared it with someone special, special enough to spend your time.
And remember that time waits for no one.
Yesterday is history.
Tomorrow a mystery.
Today is a gift.
That's why it's called the present!
Friday, October 27, 2006
How much do I initially have to invest?
How much do I initially have to invest? How much can I afford to consistently add later?
Einstein described compounding as “The Eighth Wonder of the World” and for good reason. Being able to earn interest on your interest allows investments to increase exponentially faster than with simple interest. A one-time investment of $5000 earning 10% interest compounds to a total of over $54,000 after 25 years. Using simple interest, it would take over 95 years to reach the same amount. Naturally, the larger your initial investment and the more you can afford to add later on, the more you can expect to gain in returns.
Am I carrying any high-interest debt, such as on a credit card?
Before saving for future events, you should consider your present finances. Paying off any high-interest loans function as an “automatic” return. Writing a check to Visa to pay down your debt may not feel as satisfying as starting a nest egg, but by eliminating those 22% interest payments, you have effectively “made” a 22% return. Although you need not completely eliminate your debts, getting such payments into a reasonable area should be a more pressing priority.
This fiscal reckoning is also a good time to examine budgeting and expenditures. Look for unneeded or overpriced purchases, and consider the feasibility of paring them down and saving the extra money. Unused gym memberships, that $5 whipped mocha-hazelnut cappuccino, and extra cable channels all add up. The true cost of these and all other purchases involves understanding the “time value of money”, but for now it should suffice to say that $5 added to the previously mentioned investment account compounding 10% for 25 years turns into $54.17.
What is my risk tolerance? What is my investing style?
This question leads us to selecting individual investments. Consider your investment timetable for when you’ll need the money, recognizing that more conservative selections should be made the shorter the window. Everyone’s risk tolerance is different; while one person may feel comfortable with small-cap biotechs another may need a blue chip to feel equally sound.
Analyzing the risk to reward ratio here is a good first step. The more risk you take on, the more you should expect to get in return if your investment pays off. The inverse is also true: the more stable an investment, the less return one should expect. Government-backed I Bonds pay over 6%, but involve tying up money for years in order to fully benefit from them. While this gives you one target, the average return of the broader market indices is about 11% per year. There are two primary schools of thought about investing: growth and value.
Growth
Growth investing is a higher-risk strategy which focuses on finding smaller companies poised to rapidly grow earnings. Stocks here tend to be micro-caps or small-caps, and the occasional mid-cap (under $10 billion). In their younger lives, many of the well-established companies of today found themselves considered here (Think of Apple Computers (AAPL) or Starbucks (SBUX)). Growth companies can be found in many different sectors, although such companies often have similar traits. A growth company usually has a unique product or service to offer which can fundamentally change how business is done. When found early enough in their growth cycles, these companies have the potential to return enormous profits to investors.
Value
Value plays usually are found in larger companies, although the strategies used to find them can be applied to smaller corporations as well. Looking for value stocks is similar to looking for values in a store: find a good product at a price below what you would normally expect to pay. These bargains are often found in the form of companies which have been unfairly beaten down through overselling. Finding value stocks usually involves using a discounted cash flow model (DCF) to find a company’s intrinsic value. This is the form of investing advocated by Benjamin Graham, and popularized by Warren Buffett.
GARP
GARP, or Growth At Reasonable Price, is a combination of the above forms. As the name implies, the focus is finding growing companies trading at reasonable prices. Quick measures of this include the PEG ratio (Price to Earnings to Growth) and Forward P/E. Although not a specific style, GARP is utilized by many investors because of its flexibility. The average, diversified portfolio will have many GARP-type stocks in it.
Getting Started: Learning the Market and Selecting Stocks
If you were going to spend several thousand dollars on a refrigerator or television, you would thoroughly research the market for those goods to find the product which best suited your needs. Investing is no different. Before buying into a company, you should be well-acquainted enough with it to give a short presentation. Knowing the basics of how a company operates, what it sells, how it makes money, how much money it makes, and what kind of growth the company is expected to experience are all crucial questions that any investor should be able to answer. Developing a better understanding of the stock market is a long, but hopefully rewarding, process.
Immediately investing in stocks with real money, however, is equivalent to taking a test without being introduced to the material. Formerly called “paper trading”, beginning investors would normally spend several months tracking their stock picks without having real money on them. Thanks to technology, you can now find sites that automate (for free) the process of tracking price changes for you on the internet. Simulated investing is a risk-free way of beginning to understand market fluctuations and the forces driving them.
Examining these trends will payoff in the future, as an increased understanding of the stock market can only help you on your path to building wealth. Once you become comfortable picking your own stocks, you can still continue to “paper trade” online, as it offers the opportunity to explore and experiment with other investing styles. Gordon Gekko, the famed villain in Wall Street played by Michael Douglas, said “Information is the most valuable commodity I know of”. Ignoring for a moment that the movie ended with indictments for insider trading, the statement is true: you will not regret being an informed and intelligent investor. The market is constantly changing, but by learning the ropes of investing you too can pull off a “One Up on Wall Street”.
Tuesday, October 24, 2006
10 things the new kid on wall street needs to know
10 so you want to play the stocks kid! Well, gather around and let us share 10 things that we have learned to stick this game out for the long haul.
Being a new kid on the block of investing is a lot like being a small fish in a big pond. The new adventure of a big pond can be scary, adventure, and fun. Some keys for the new kid on wall street would be:
1) Learn to make your own decisions.
Everyone will give you advice. Most of it is worthless. You need to make your own investment decisions. It’s your money, and believe me, no one cares if you lose it. In fact, many are rooting for you to, because they want to make money off you.
2) Never blindly trust information.
You need to independently confirm every thing you hear about a stock or a company. Through good solid research yourself. People will lie, because they stand to make a ton of money from stock sales. They’ll gladly mis-represent information, so insist on looking at the real thing, real facts, and real research.
3) Do the work and understand what you’re buying.
Stock investing a fairly complex topic. It could take you many months or even years to master the basics. Mastering the basics is what you need to be concerned with. If you really thing there’s a fast buck coming your way, you need to wise up. One key that we always want to state is always investing thinking long term. Not to many people win short term though it can be done it's done by the experts!
4) Develop a trading style or system.
Don't just make up a system, but research systems, so what others do and continue to do. But, then make some small changes and make your own unique system. Don’t always base all your ideas from other famous people’s systems. In every system has it's strengths and weakness. There is no peferct system to get rich fast. A key is to come up with your own personalized investing methods and systems that work for you, your budget, your personality.
5) Ignore “HOT STOCK TIPS”.
Most hot stock tips are SCAMS!! If they were as hot as Shakira, then they would be implemented by the person who has them. The only information about investing that’s released to the masses is outdated.
6) Most people who recommend stocks do so because they have a financial inducement.
Really, just be real with yourself. Don't be so silly to really think that recommendations are just that. In the real investing world rarely are these stock or investing recommendations are not done free. Please not that most of the time the recommendations come after many, the inside guys, etc have already purchased at a lower price then what you would be getting in at.
7) Concentrate investing with a focus.
Don't go read and learn everything you can about every company or stock. You would be better off starting with a trend, or familiar with a few stocks and really research them down to the penny. Again, ALWAYS stick to your guns aka your investing plan, your investing style, and your investing strategy!
8) You need to put big money to see big profits.
Don't go quitting your day job on $5k of capital. It’s not that much money,
BUDDY! You would need a big bankroll to make decent money. This is true, but don't get the wrong idea as well. It's okay to start of with only $5k in starting a good solid investment focus. Balance is a the key, don't go to one extreme of not investing or the other extreme of quitting your day job to become a day trader on $5k of capital.
9) Don’t over due it on the diversifying or put away too much money into too many stocks.
If you do, you can expect to have a hard time getting good solid returns. If you start with a small amount of cash, you need to concentrate in one stock or few stocks to have the best result. Wait until you get some experience, some research, and before you go jumping into the deep end of the stock market.
10) Use stop losses.
Don’t ever lose more than we suggest 8% others might say 10% on any trade. If you use a stop-loss, you can guarantee that your downside is never less than 8% to 10%. This could save you in the event of a free fall. Also, a major key in this to, is to be discipline enough to keep putting in those stop losses even when the stock goes up. So say if your stock has gone up 15% well put a stop loss of a new 8% based on the 15% gain! This is discipline, but that's what it take in investing and in life!
Friday, October 20, 2006
Headwaters (HW)
Adding value to energy… and possibly your portfolio.
By eInvesting.com
Value investing involves finding a discrepancy between the price of a security and the value of the underlying company. Some people criticize value investing as boring or too prone to overlooking growth opportunities. But what happens if a solid, cash producing business was integrated with a research group intent on finding synergies to generate additional earnings from current operations, and also on finding important new breakthroughs to fuel growth further down in the company’s life?
That company would be Headwaters (ticker: HW), which has three distinct operating divisions - construction materials, coal, and alternative energy. Before I get into valuation, here is an overview of Headwaters’ various segments.
The materials unit currently makes up a majority of earnings and revenues, and involvement in that industry was management's decision to diversify the more risky and cyclical energy operations which offer most of the growth potential. While revenues have undoubtedly been raised by the housing construction boom, only about one-third of Headwaters sales in the area are for new housing construction, so any decrease in revenues and earnings because of fewer housing starts should be minimal. Wisely, there are already some synergies within the company because Headwaters converts used coal into concrete additives and synthetic stone. The use of fly ash-based concrete reduces atmospheric pollution, and as such is endorsed by the federal government and all fifty states for government contracts. Fly ash is also finding its way into mortars and stuccos, which Headwaters sells. Over the last few years, Headwaters has been making capital expenditures to expand its distribution network and establish itself in the field of building supplies. The conservative scenario is for Headwaters to keep capital expenditures in-line with revenues and earnings, so no marginal decrease in free cash flow rates should occur from the Materials division. Look for solid earnings and consistent growth.
The coal division is involved in coal combustion and by-product utilization (see above). Headwaters makes using coal inherently more efficient, and then also finds ways to add value to the byproducts after it has been used to produce energy. Coal remains a cheap, easy way to generate power and with the volatile and increasingly expensive, coal will become even more important in generating energy, both in America and around the globe. There are over 150 proposed coal-fired plants in the U.S. (not to mention hundreds more in other parts of the world), and environmental groups, while usually unable to stop construction, can at least get laws applied to make the coal “cleaner”. Headwaters is perfectly positioned for such a trend, offering both emissions control should coal be burned and is developing coal-to-liquids technology to allow for the creation of synthetic crude oil or natural gas from coal.
Considering that approximately 95% of America’s energy production capacity comes from coal, an amount significantly greater than can be found in the oil reserves of the Middle East, the uses for coal, and coal-to-liquids technology, seem abundant.
The final and most dynamic division is the Technology and Innovation unit, which does research in the alternative energy and heavy-oil areas. For everything you hear about the Canadian oil sands, regular refiners have enough problems handling and grade worse than light, sweet crude. As the remaining supplies of light, sweet crude are extracted, eventually more inferior grades will need to be refined… all the way to tar sands, which is proving the most difficult to handle. Headwaters’ (HC)3 Hydrocracking technology allows for heavy oil to be upgraded to more easily refined grades. Additionally, Hydrocracking can be used on low quality distillates remaining after the initial refining to turn them into higher-value petroleum products. A quick value-added calculation shows that it could easily be a multi-billion dollar addition to the economy, and if Headwaters' maintains its standard operating margin of 11% on it (not to say that it couldn't be higher, but I'm being conservative) it could double earnings just from capturing the upgrading market. If HC3 gained wider use as light oil blends decline and refiners increasingly switch to heavy oil, that could add even more to the bottom line. The high-side estimate for "upgrading" profits is about $600 million. Such a number does not include any profits to be made from applying Hydrocracking technology to the Canadian Tar Sands, as for now that is still too speculative to count on as a potential future revenue.
Headwaters is also involved in nanotechnology and fuel cell research, with numerous potential applications. Their proprietary NxCat nanotechnology is claimed to be the most efficient nanoagent created, outperforming today’s standard catalysts. More uses are being tested involving hydrogen peroxide production, LED displays, and carbon nanotubes. These potential breakthrough, while difficult to value directly, should be treated like having a free call option on an exciting and potentially lucrative future investment.
Current financial status and valuation: Headwaters has had a rough several months, with the rise in oil prices leading to a phasing out of tax credits benefiting some of Headwaters synthetic fuel catalysts. Headwaters has gone from $40 to near $20 back to $25 in the last few months as analysts have cut short term earnings estimates. Having become interested in this stock the first time it traded down through $25, I will admit to becoming bullish too soon and trying to “catch the falling knife”. The stock has begun to swing back up on some positive news, and buying now will mean that, although you missed the first 20% of the move, there could still be plenty of profit ahead.
For a company capitalized at just over $1 billion to have a trailing twelve month free cash flow of $150 million is amazing. HW does have about $500 million in debt, but I'm not too concerned about that because of the large cash flows which can be used to pay that down. They have cut total outstanding debt by 30% since the end of 2004, and the SEC filings say that Headwaters is prohibited from paying a dividend until it has no outstanding long-term liabilities. As long as Headwaters continues to pull in so much cash, their debt position should be no problem. Taking into all the above factors, if the company can eke out a moderate growth in the high single digit range over the next few years, a conservative exit multiple off that free cash flow makes HW undervalued by 35% - or about $35 per share. When you think of the huge potential gains down the road from the many growth areas the company has, its easy to see how this could be a $40 or even $50 stock sometime in the next year or two.
eInvesting.com is a free stock market simulator and forum. The author has no financial position in any stocks mentioned.
Thursday, October 19, 2006
Escala Group Inc. (ESCL)
Escala Group Inc. (ESCL)
ABOUT ESCALA GROUP
Escala Group is a global federation of leading companies in the collectibles market with operations in North America, Europe and Asia as well as on the Internet. The company operates through a number of subsidiaries that specialize in various sectors of the collectibles markets, and is comprised of three business areas: auctions, merchant/dealer operations and trading.
Escala Group's North American operations include Greg Manning Auctions division, Ivy & Manning Philatelic Auctions, Greg Manning Galleries, Greg Martin Auctions, Spectrum Numismatics, Teletrade, Nutmeg Stamp Sales, Superior Sports Auctions, Bowers and Merena Auctions, and Kingswood Coin Auctions, and H.R. Harmer. In Europe, the leading auction houses affiliated with the network are Auctentia Subastas (Afinsa Auctions) of Madrid, Spain, Corinphila Auktionen of Zurich, Switzerland, and the Koehler group of auction companies of Berlin and Wiesbaden, Germany. In Asia, Escala's auctions operations are conducted through John Bull Stamp Auctions, Ltd, the oldest philatelic auction house in Hong Kong.
The trading activities of Escala Group are conducted through A-Mark Precious Metals, one of the largest private sellers of bullion coins and bullion gold, silver and platinum to the wholesale marketplace.
Tuesday, October 17, 2006
Angeion Corp. (ANGN)
Angeion looks to be a buy for us here at 'Stocks Online'
These charts look good to me ANGN charts, but what do I know!
Also, it has some really good chart on stock charts check it out here!
One good thing that I really enjoyed and stuck out was the earning went from a loss of $(1.86)/share in 2001 down to a loss of $(.25)/share in 2005. The Angeion (ANGN) has turned around a profit with $.41/share reported. The Angeion (ANGN) has kept its 4 million shares outstanding stable from 2001 to present reports.
One thing that is a must for a lot of fundamentals is the free cash flow! Which with ANGN has been negative at $(1) million in 2003-2005, turned positive with $2 million reported as of recently. So that's a pretty impressive turnout that is turning a lot of head including ours here at stocks online! Also, with a $2.5 million in cash and $11.9 million in other current assets.
Seems to be an interesting look or at least one to be checking out and keeping an eye on it. Espcially after Angeion (ANGN) shares soared 80% on Monday after the tiny medical diagnostic systems maker swung to a fiscal third-quarter profit.
Wednesday, October 11, 2006
Technical vs. Fundamental Analysis
Technical vs. Fundamental Analysis
By Thomas Stone of statisticaltrading.com
The debate rages on. Which is better, technical analysis or fundamental analysis?
The question seems simple but it is deceptive. Underneath the question is an unspoken assumption about time horizons. Is the questioner an investor or a trader?
An investor is becoming part of something. The investor makes his choices based on a belief in the future. He desires to help make something successful. If he believes that apples will be in great demand next year he may invest in an orchard to grow apples for sale next year. During the year, while his apples are growing, he may ignore the day-to-day price changes of apples because his focus is on next year.
The trader doesn’t care to be part of anything other than the enterprise of making money. If he thinks orchards will increase in price next week, he’ll buy an orchard. He doesn’t care about orchards or apples. He’d buy a worm farm today if he thought he could turn a dime on it next week. He is very concerned about day-to-day price fluctuations since it is the past behavior of prices that make him expect the price to go up next week.
If the belief in the future value of apples is shaken then some of the orchard investors may decide that running an orchard isn’t the best choice. They abandon the business. Other investors see the cost of orchards dropping and, at some price point, believe that the now lower cost of orchards justifies the apple business given the reduced future price of apples. They start buying orchards.
This doesn’t happen all at once. Not everyone agrees with the amount that the price of apples will drop by. Because of this, different people see different price points as being good times to get back into the apple business.
The investor uses fundamental analysis to make his decisions, but what is the trader doing?
The trader is watching the patterns in the price of orchards and how frequently orchards are changing ownership as the prices go up or down. Eventually the pattern looks like a pattern that he has seen many times before and it usually occurs when prices have finished dropping and they are about to start escalating. Based on this, he decides to buy an orchard. He will hold that orchard until he thinks that he sees a pattern that suggests that the price of orchards will stop going up. He then sells the orchard. He has used technical analysis.
The trader’s technical analysis would be worthless without investors doing their fundamental analysis. Without the investors, there would be no patterns to watch for. It is the investors making their decisions based on fundamental analysis that creates the pricing patterns that the technical trader watches. The pricing pattern that indicates a bottoming in prices occurs when the price falls far enough to start attracting a large number of investors.
In the end, neither is better. Both technical and fundamental analysis help to create an efficient marketplace that can deliver goods to the consumer.
I refer to users of technical analysis as traders and users of fundamental analysis as investors. Their time horizons usually differ. Traders look to get in and out of a trade in hours, days, weeks, and sometimes months. Investors usually get in for months to years.
If you have a strong belief that something is going to happen and you are in the minority then you have an excellent opportunity to make a lot of money by investing in companies that stand to profit from that eventuality. Those profits won’t materialize until you are no longer in the minority. As more and more people start to share your belief, the prices of those companies will rise and you can profit handsomely. While you are waiting for others to start sharing your beliefs, the prices of those companies may go up and down. As long as your belief isn’t swayed you may bear those price swings secure in the knowledge of what is to come. You are an investor. On the other hand, if you’re wrong…
An example may be a belief that there will be water shortages resulting from global warming. Believing this, you may decide to invest part of your money in companies that build desalinization plants. You believe that, over the next 10-15 years, these companies’ products will see soaring demand. Secure in the belief that this will occur, you will not be terribly concerned if the price of one of those companies drops 5 percent next month. You believe that it will recover and then some. You are basing your decision on fundamental analysis.
The above is fundamental analysis on a macro economic scale. Bringing fundamental analysis to bear on a company-by-company basis is much more difficult. Numerous data points need to be entered, many of which are not available as hard data but rely on assumptions made by the person performing the fundamental analysis. One type of fundamental analysis called Discounted Cash Flow (DCF) is currently very popular. It involves formulas that take operating profit, depreciation, amortization, goodwill, capital expenditures, cash taxes, changes in working capital, and weighted average cost of capital, to arrive at a valuation for a company (see http://www.investopedia.com/articles/03/011403.asp for more detail).
Just collecting the data needed to perform the analysis for a single company can be a daunting task. Performing this kind of analysis on a large number of companies on a regular basis quickly becomes a full time job.
The trader on the other hand can use computers to scan for likely candidates for the pricing patterns that he uses. Within minutes a computer can download data on thousands of stocks and have the computer bring up relatively short lists of stocks that are potential candidates for trades.
A trader may also use technical analysis on the market as a whole to move money back and forth between an index fund and a money market fund. One simple way to do this is by using the market breadth.
Market breadth is simply a measure of the difference between the number of advancing issues and the number of declining issues on an exchange such as the NYSE. If 1200 stocks go up in price and 500 go down in price then the breadth is +700. We can calculate this number every day and then look for trends by calculating moving averages of these numbers. A good way to get long term directional movements is to analysis how two different moving averages changes relative to each other. The name for that practice is called Moving Average Convergence Divergence or MACD. If we apply MACD to the breadth using a 19-day and a 39-day moving average then we get a well-known indicator called the McClellan Summation Index (MSI).
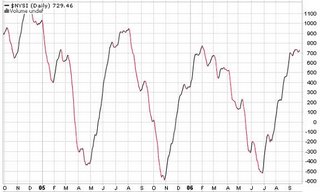
Figure 1: MSI courtesy of StockCharts.com
If we look at the SP-500 for the same time frame
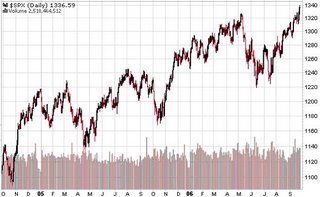
Figure 2: SP-500 courtesy of Stockcharts.com
If you had bought and sold an index fund based on the MSI peaks and valleys then you would have made the following trades (numbers and dates approximated)
Purchase date Cost Sales Date Price Profit/(Loss)
Late April ‘05 $1140 Late July ‘05 $1240 8.5%
Late Oct ‘05 $1180 Late Jan ‘06 $1280 8.5%
Late June ‘06 $1240 Late Sept ‘06 $1335 7.5%
You would have been in the market for 9 out of the last 17 months. While in the market you would have realized a 24.5% return plus the money market interest earned during the other 8 months, lets say 2.5%. That works out to a 19% annualized return (27*(12/17)).
How do you know when the MSI is at a peak or a valley? I use the MACD of the MSI with the averages being 30-day and 50-day. This smoothes out the action of the MSI and clearly shows the overall direction that it is moving in.

Figure 3: MACD of MSI courtesy of Stockcharts.com
The black line on the graph is a 9-day moving average of the red line. The red line is the MACD. The histogram shows the difference between the red and black line. The buy signal is when the MSI falls below –300 and the black line crosses up over the red line as it did in late Apr ’05, early Nov ’05, and late June ’06. The sell signal is when the MSI rises above +500 and the black line falls under the red line as it did in late July ’05, early Feb ’06, and late Sept ’06.
This indicator is not perfect at picking tops and bottoms. It is good at warning when the breadth of the market is no longer supportive of the direction of the market. The market usually changes direction shortly after that occurs. In the spring of ’06, this indicator was falling while the market indexes were advancing for an unusually long time. This meant that the number of stocks participating in the market move was dropping off. Fewer and fewer stocks were trading above their 40-day moving averages each week even as the SP-500 moved upward.
There are numerous technical indicators in use and there are many good books that discuss these indicators in depth. One such book is “New Trading Systems and Methods” by Perry J Kaufman. There are also computer programs that can be purchased that have many of these indictors built in such as TC2005 from Worden Bros (www.worden.com). There are also websites that have many of these indicators built in and some on-line brokers have charting packages containing some of the indicators.
The extreme in technical analysis is called Mechanical Trading. In mechanical trading a computer has extensively tested a set of indicators over numerous sets of historical data to arrive at an “ideal” set of indicators which the computer uses to issue buy and sell recommendations completely without any human intervention. My website, www.statisticaltrading.com, allows people to subscribe to computer generated buy and sell recommendations. Our computers have honed sets of technical indicators that have over 83% success rates with average holding times of 5-6 weeks. All recommendations come in the evening for execution at the next morning’s open; there is no day trading support on the site. We also offer a market timing service and a dividend investing service.
By Thomas Stone of statisticaltrading.com
The debate rages on. Which is better, technical analysis or fundamental analysis?
The question seems simple but it is deceptive. Underneath the question is an unspoken assumption about time horizons. Is the questioner an investor or a trader?
An investor is becoming part of something. The investor makes his choices based on a belief in the future. He desires to help make something successful. If he believes that apples will be in great demand next year he may invest in an orchard to grow apples for sale next year. During the year, while his apples are growing, he may ignore the day-to-day price changes of apples because his focus is on next year.
The trader doesn’t care to be part of anything other than the enterprise of making money. If he thinks orchards will increase in price next week, he’ll buy an orchard. He doesn’t care about orchards or apples. He’d buy a worm farm today if he thought he could turn a dime on it next week. He is very concerned about day-to-day price fluctuations since it is the past behavior of prices that make him expect the price to go up next week.
If the belief in the future value of apples is shaken then some of the orchard investors may decide that running an orchard isn’t the best choice. They abandon the business. Other investors see the cost of orchards dropping and, at some price point, believe that the now lower cost of orchards justifies the apple business given the reduced future price of apples. They start buying orchards.
This doesn’t happen all at once. Not everyone agrees with the amount that the price of apples will drop by. Because of this, different people see different price points as being good times to get back into the apple business.
The investor uses fundamental analysis to make his decisions, but what is the trader doing?
The trader is watching the patterns in the price of orchards and how frequently orchards are changing ownership as the prices go up or down. Eventually the pattern looks like a pattern that he has seen many times before and it usually occurs when prices have finished dropping and they are about to start escalating. Based on this, he decides to buy an orchard. He will hold that orchard until he thinks that he sees a pattern that suggests that the price of orchards will stop going up. He then sells the orchard. He has used technical analysis.
The trader’s technical analysis would be worthless without investors doing their fundamental analysis. Without the investors, there would be no patterns to watch for. It is the investors making their decisions based on fundamental analysis that creates the pricing patterns that the technical trader watches. The pricing pattern that indicates a bottoming in prices occurs when the price falls far enough to start attracting a large number of investors.
In the end, neither is better. Both technical and fundamental analysis help to create an efficient marketplace that can deliver goods to the consumer.
I refer to users of technical analysis as traders and users of fundamental analysis as investors. Their time horizons usually differ. Traders look to get in and out of a trade in hours, days, weeks, and sometimes months. Investors usually get in for months to years.
If you have a strong belief that something is going to happen and you are in the minority then you have an excellent opportunity to make a lot of money by investing in companies that stand to profit from that eventuality. Those profits won’t materialize until you are no longer in the minority. As more and more people start to share your belief, the prices of those companies will rise and you can profit handsomely. While you are waiting for others to start sharing your beliefs, the prices of those companies may go up and down. As long as your belief isn’t swayed you may bear those price swings secure in the knowledge of what is to come. You are an investor. On the other hand, if you’re wrong…
An example may be a belief that there will be water shortages resulting from global warming. Believing this, you may decide to invest part of your money in companies that build desalinization plants. You believe that, over the next 10-15 years, these companies’ products will see soaring demand. Secure in the belief that this will occur, you will not be terribly concerned if the price of one of those companies drops 5 percent next month. You believe that it will recover and then some. You are basing your decision on fundamental analysis.
The above is fundamental analysis on a macro economic scale. Bringing fundamental analysis to bear on a company-by-company basis is much more difficult. Numerous data points need to be entered, many of which are not available as hard data but rely on assumptions made by the person performing the fundamental analysis. One type of fundamental analysis called Discounted Cash Flow (DCF) is currently very popular. It involves formulas that take operating profit, depreciation, amortization, goodwill, capital expenditures, cash taxes, changes in working capital, and weighted average cost of capital, to arrive at a valuation for a company (see http://www.investopedia.com/articles/03/011403.asp for more detail).
Just collecting the data needed to perform the analysis for a single company can be a daunting task. Performing this kind of analysis on a large number of companies on a regular basis quickly becomes a full time job.
The trader on the other hand can use computers to scan for likely candidates for the pricing patterns that he uses. Within minutes a computer can download data on thousands of stocks and have the computer bring up relatively short lists of stocks that are potential candidates for trades.
A trader may also use technical analysis on the market as a whole to move money back and forth between an index fund and a money market fund. One simple way to do this is by using the market breadth.
Market breadth is simply a measure of the difference between the number of advancing issues and the number of declining issues on an exchange such as the NYSE. If 1200 stocks go up in price and 500 go down in price then the breadth is +700. We can calculate this number every day and then look for trends by calculating moving averages of these numbers. A good way to get long term directional movements is to analysis how two different moving averages changes relative to each other. The name for that practice is called Moving Average Convergence Divergence or MACD. If we apply MACD to the breadth using a 19-day and a 39-day moving average then we get a well-known indicator called the McClellan Summation Index (MSI).

Figure 1: MSI courtesy of StockCharts.com
If we look at the SP-500 for the same time frame

Figure 2: SP-500 courtesy of Stockcharts.com
If you had bought and sold an index fund based on the MSI peaks and valleys then you would have made the following trades (numbers and dates approximated)
Purchase date Cost Sales Date Price Profit/(Loss)
Late April ‘05 $1140 Late July ‘05 $1240 8.5%
Late Oct ‘05 $1180 Late Jan ‘06 $1280 8.5%
Late June ‘06 $1240 Late Sept ‘06 $1335 7.5%
You would have been in the market for 9 out of the last 17 months. While in the market you would have realized a 24.5% return plus the money market interest earned during the other 8 months, lets say 2.5%. That works out to a 19% annualized return (27*(12/17)).
How do you know when the MSI is at a peak or a valley? I use the MACD of the MSI with the averages being 30-day and 50-day. This smoothes out the action of the MSI and clearly shows the overall direction that it is moving in.
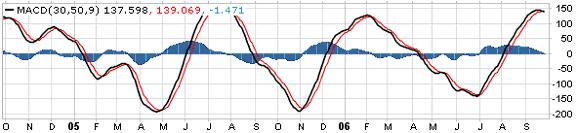
Figure 3: MACD of MSI courtesy of Stockcharts.com
The black line on the graph is a 9-day moving average of the red line. The red line is the MACD. The histogram shows the difference between the red and black line. The buy signal is when the MSI falls below –300 and the black line crosses up over the red line as it did in late Apr ’05, early Nov ’05, and late June ’06. The sell signal is when the MSI rises above +500 and the black line falls under the red line as it did in late July ’05, early Feb ’06, and late Sept ’06.
This indicator is not perfect at picking tops and bottoms. It is good at warning when the breadth of the market is no longer supportive of the direction of the market. The market usually changes direction shortly after that occurs. In the spring of ’06, this indicator was falling while the market indexes were advancing for an unusually long time. This meant that the number of stocks participating in the market move was dropping off. Fewer and fewer stocks were trading above their 40-day moving averages each week even as the SP-500 moved upward.
There are numerous technical indicators in use and there are many good books that discuss these indicators in depth. One such book is “New Trading Systems and Methods” by Perry J Kaufman. There are also computer programs that can be purchased that have many of these indictors built in such as TC2005 from Worden Bros (www.worden.com). There are also websites that have many of these indicators built in and some on-line brokers have charting packages containing some of the indicators.
The extreme in technical analysis is called Mechanical Trading. In mechanical trading a computer has extensively tested a set of indicators over numerous sets of historical data to arrive at an “ideal” set of indicators which the computer uses to issue buy and sell recommendations completely without any human intervention. My website, www.statisticaltrading.com, allows people to subscribe to computer generated buy and sell recommendations. Our computers have honed sets of technical indicators that have over 83% success rates with average holding times of 5-6 weeks. All recommendations come in the evening for execution at the next morning’s open; there is no day trading support on the site. We also offer a market timing service and a dividend investing service.
Monday, October 09, 2006
Getting Started: Learning the Market and Selecting Stocks
Getting Started: Learning the Market and Selecting Stocks
If you were going to spend several thousand dollars on a refrigerator or television, you would thoroughly research the market for those goods to find the product which best suited your needs. Investing is no different. Before buying into a company, you should be well-acquainted enough with it to give a short presentation. Knowing the basics of how a company operates, what it sells, how it makes money, how much money it makes, and what kind of growth the company is expected to experience are all crucial questions that any investor should be able to answer. Developing a better understanding of the stock market is a long, but hopefully rewarding, process. Immediately investing in stocks with real money, however, is equivalent to taking a test without being introduced to the material. Formerly called “paper trading”, beginning investors would normally spend several months tracking their stock picks without having real money on them. Thanks to technology, you can now find sites that automate (for free) the process of tracking price changes for you on the internet. Simulated investing is a risk-free way of beginning to understand market fluctuations and the forces driving them. Examining these trends will payoff in the future, as an increased understanding of the stock market can only help you on your path to building wealth. Once you become comfortable picking your own stocks, you can still continue to “paper trade” online, as it offers the opportunity to explore and experiment with other investing styles. Gordon Gekko, the famed villain in Wall Street played by Michael Douglas, said “Information is the most valuable commodity I know of”. Ignoring for a moment that the movie ended with indictments for insider trading, the statement is true: you will not regret being an informed and intelligent investor. The market is constantly changing, but by learning the ropes of investing you too can pull off a “One Up on Wall Street”.
Especialy thanks from einvesting.com Don't start investing alone. Check out einvesting.com today!
Thursday, October 05, 2006
GARP
GARP
GARP, or Growth At Reasonable Price. As the name implies, the focus is finding growing companies trading at reasonable prices. Quick measures of this include the PEG ratio (Price to Earnings to Growth) and Forward P/E. Although not a specific style, GARP is utilized by many investors because of its flexibility. The average, diversified portfolio will have many GARP-type stocks in it.
GARP, or Growth At Reasonable Price. As the name implies, the focus is finding growing companies trading at reasonable prices. Quick measures of this include the PEG ratio (Price to Earnings to Growth) and Forward P/E. Although not a specific style, GARP is utilized by many investors because of its flexibility. The average, diversified portfolio will have many GARP-type stocks in it.
Wednesday, October 04, 2006
What is my risk tolerance and investing style
What is my risk tolerance? What is my investing style?
This question leads us to selecting individual investments. Consider your investment timetable for when you’ll need the money, recognizing that more conservative selections should be made the shorter the window. Everyone’s risk tolerance is different; while one person may feel comfortable with small-cap biotechs another may need a blue chip to feel equally sound.
Analyzing the risk to reward ratio here is a good first step. The more risk you take on, the more you should expect to get in return if your investment pays off. The inverse is also true: the more stable an investment, the less return one should expect. Government-backed I Bonds pay over 6%, but involve tying up money for years in order to fully benefit from them. While this gives you one target, the average return of the broader market indices is about 11% per year. There are two primary schools of thought about investing: growth and value.
Growth
Growth investing is a higher-risk strategy which focuses on finding smaller companies poised to rapidly grow earnings. Stocks here tend to be micro-caps or small-caps, and the occasional mid-cap (under $10 billion). In their younger lives, many of the well-established companies of today found themselves considered here (Think of Apple Computers (AAPL) or Starbucks (SBUX)). Growth companies can be found in many different sectors, although such companies often have similar traits. A growth company usually has a unique product or service to offer which can fundamentally change how business is done. When found early enough in their growth cycles, these companies have the potential to return enormous profits to investors.
Value
Value plays usually are found in larger companies, although the strategies used to find them can be applied to smaller corporations as well. Looking for value stocks is similar to looking for values in a store: find a good product at a price below what you would normally expect to pay. These bargains are often found in the form of companies which have been unfairly beaten down through overselling. Finding value stocks usually involves using a discounted cash flow model (DCF) to find a company’s intrinsic value. This is the form of investing advocated by Benjamin Graham, and popularized by Warren Buffett.
Questions to ask before investing
Questions to ask before investing
How much do I initially have to invest? How much can I afford to consistently add later?
Einstein described compounding as “The Eighth Wonder of the World” and for good reason. Being able to earn interest on your interest allows investments to increase exponentially faster than with simple interest. A one-time investment of $5000 earning 10% interest compounds to a total of over $54,000 after 25 years. Using simple interest, it would take over 95 years to reach the same amount. Naturally, the larger your initial investment and the more you can afford to add later on, the more you can expect to gain in returns.
Am I carrying any high-interest debt, such as on a credit card?
Before saving for future events, you should consider your present finances. Paying off any high-interest loans function as an “automatic” return. Writing a check to Visa to pay down your debt may not feel as satisfying as starting a nest egg, but by eliminating those 22% interest payments, you have effectively “made” a 22% return. Although you need not completely eliminate your debts, getting such payments into a reasonable area should be a more pressing priority.
This fiscal reckoning is also a good time to examine budgeting and expenditures. Look for unneeded or overpriced purchases, and consider the feasibility of paring them down and saving the extra money. Unused gym memberships, that $5 whipped mocha-hazelnut cappuccino, and extra cable channels all add up. The true cost of these and all other purchases involves understanding the “time value of money”, but for now it should suffice to say that $5 added to the previously mentioned investment account compounding 10% for 25 years turns into $54.17.
Technical vs. Fundamental Analysis
Technical vs. Fundamental Analysis
By Thomas Stone of statisticaltrading.com
The debate rages on. Which is better, technical analysis or fundamental analysis?
The question seems simple but it is deceptive. Underneath the question is an unspoken assumption about time horizons. Is the questioner an investor or a trader?
An investor is becoming part of something. The investor makes his choices based on a belief in the future. He desires to help make something successful. If he believes that apples will be in great demand next year he may invest in an orchard to grow apples for sale next year. During the year, while his apples are growing, he may ignore the day-to-day price changes of apples because his focus is on next year.
The trader doesn’t care to be part of anything other than the enterprise of making money. If he thinks orchards will increase in price next week, he’ll buy an orchard. He doesn’t care about orchards or apples. He’d buy a worm farm today if he thought he could turn a dime on it next week. He is very concerned about day-to-day price fluctuations since it is the past behavior of prices that make him expect the price to go up next week.
If the belief in the future value of apples is shaken then some of the orchard investors may decide that running an orchard isn’t the best choice. They abandon the business. Other investors see the cost of orchards dropping and, at some price point, believe that the now lower cost of orchards justifies the apple business given the reduced future price of apples. They start buying orchards.
This doesn’t happen all at once. Not everyone agrees with the amount that the price of apples will drop by. Because of this, different people see different price points as being good times to get back into the apple business.
The investor uses fundamental analysis to make his decisions, but what is the trader doing?
The trader is watching the patterns in the price of orchards and how frequently orchards are changing ownership as the prices go up or down. Eventually the pattern looks like a pattern that he has seen many times before and it usually occurs when prices have finished dropping and they are about to start escalating. Based on this, he decides to buy an orchard. He will hold that orchard until he thinks that he sees a pattern that suggests that the price of orchards will stop going up. He then sells the orchard. He has used technical analysis.
The trader’s technical analysis would be worthless without investors doing their fundamental analysis. Without the investors, there would be no patterns to watch for. It is the investors making their decisions based on fundamental analysis that creates the pricing patterns that the technical trader watches. The pricing pattern that indicates a bottoming in prices occurs when the price falls far enough to start attracting a large number of investors.
In the end, neither is better. Both technical and fundamental analysis help to create an efficient marketplace that can deliver goods to the consumer.
I refer to users of technical analysis as traders and users of fundamental analysis as investors. Their time horizons usually differ. Traders look to get in and out of a trade in hours, days, weeks, and sometimes months. Investors usually get in for months to years.
If you have a strong belief that something is going to happen and you are in the minority then you have an excellent opportunity to make a lot of money by investing in companies that stand to profit from that eventuality. Those profits won’t materialize until you are no longer in the minority. As more and more people start to share your belief, the prices of those companies will rise and you can profit handsomely. While you are waiting for others to start sharing your beliefs, the prices of those companies may go up and down. As long as your belief isn’t swayed you may bear those price swings secure in the knowledge of what is to come. You are an investor. On the other hand, if you’re wrong…
An example may be a belief that there will be water shortages resulting from global warming. Believing this, you may decide to invest part of your money in companies that build desalinization plants. You believe that, over the next 10-15 years, these companies’ products will see soaring demand. Secure in the belief that this will occur, you will not be terribly concerned if the price of one of those companies drops 5 percent next month. You believe that it will recover and then some. You are basing your decision on fundamental analysis.
The above is fundamental analysis on a macro economic scale. Bringing fundamental analysis to bear on a company-by-company basis is much more difficult. Numerous data points need to be entered, many of which are not available as hard data but rely on assumptions made by the person performing the fundamental analysis. One type of fundamental analysis called Discounted Cash Flow (DCF) is currently very popular. It involves formulas that take operating profit, depreciation, amortization, goodwill, capital expenditures, cash taxes, changes in working capital, and weighted average cost of capital, to arrive at a valuation for a company (see http://www.investopedia.com/articles/03/011403.asp for more detail).
Just collecting the data needed to perform the analysis for a single company can be a daunting task. Performing this kind of analysis on a large number of companies on a regular basis quickly becomes a full time job.
The trader on the other hand can use computers to scan for likely candidates for the pricing patterns that he uses. Within minutes a computer can download data on thousands of stocks and have the computer bring up relatively short lists of stocks that are potential candidates for trades.
A trader may also use technical analysis on the market as a whole to move money back and forth between an index fund and a money market fund. One simple way to do this is by using the market breadth.
Market breadth is simply a measure of the difference between the number of advancing issues and the number of declining issues on an exchange such as the NYSE. If 1200 stocks go up in price and 500 go down in price then the breadth is +700. We can calculate this number every day and then look for trends by calculating moving averages of these numbers. A good way to get long term directional movements is to analysis how two different moving averages changes relative to each other. The name for that practice is called Moving Average Convergence Divergence or MACD. If we apply MACD to the breadth using a 19-day and a 39-day moving average then we get a well-known indicator called the McClellan Summation Index (MSI).
Figure 1: MSI courtesy of StockCharts.com
If we look at the SP-500 for the same time frame
Figure 2: SP-500 courtesy of Stockcharts.com
If you had bought and sold an index fund based on the MSI peaks and valleys then you would have made the following trades (numbers and dates approximated)
Purchase date Cost Sales Date Price Profit/(Loss)
Late April ‘05 $1140 Late July ‘05 $1240 8.5%
Late Oct ‘05 $1180 Late Jan ‘06 $1280 8.5%
Late June ‘06 $1240 Late Sept ‘06 $1335 7.5%
You would have been in the market for 9 out of the last 17 months. While in the market you would have realized a 24.5% return plus the money market interest earned during the other 8 months, lets say 2.5%. That works out to a 19% annualized return (27*(12/17)).
How do you know when the MSI is at a peak or a valley? I use the MACD of the MSI with the averages being 30-day and 50-day. This smoothes out the action of the MSI and clearly shows the overall direction that it is moving in.
Figure 3: MACD of MSI courtesy of Stockcharts.com
The black line on the graph is a 9-day moving average of the red line. The red line is the MACD. The histogram shows the difference between the red and black line. The buy signal is when the MSI falls below –300 and the black line crosses up over the red line as it did in late Apr ’05, early Nov ’05, and late June ’06. The sell signal is when the MSI rises above +500 and the black line falls under the red line as it did in late July ’05, early Feb ’06, and late Sept ’06.
This indicator is not perfect at picking tops and bottoms. It is good at warning when the breadth of the market is no longer supportive of the direction of the market. The market usually changes direction shortly after that occurs. In the spring of ’06, this indicator was falling while the market indexes were advancing for an unusually long time. This meant that the number of stocks participating in the market move was dropping off. Fewer and fewer stocks were trading above their 40-day moving averages each week even as the SP-500 moved upward.
There are numerous technical indicators in use and there are many good books that discuss these indicators in depth. One such book is “New Trading Systems and Methods” by Perry J Kaufman. There are also computer programs that can be purchased that have many of these indictors built in such as TC2005 from Worden Bros (www.worden.com). There are also websites that have many of these indicators built in and some on-line brokers have charting packages containing some of the indicators.
The extreme in technical analysis is called Mechanical Trading. In mechanical trading a computer has extensively tested a set of indicators over numerous sets of historical data to arrive at an “ideal” set of indicators which the computer uses to issue buy and sell recommendations completely without any human intervention. My website, www.statisticaltrading.com, allows people to subscribe to computer generated buy and sell recommendations. Our computers have honed sets of technical indicators that have over 83% success rates with average holding times of 5-6 weeks. All recommendations come in the evening for execution at the next morning’s open; there is no day trading support on the site. We also offer a market timing service and a dividend investing service.
Subscribe to:
Posts (Atom)