By Thomas Stone of statisticaltrading.com
The debate rages on. Which is better, technical analysis or fundamental analysis?
The question seems simple but it is deceptive. Underneath the question is an unspoken assumption about time horizons. Is the questioner an investor or a trader?
An investor is becoming part of something. The investor makes his choices based on a belief in the future. He desires to help make something successful. If he believes that apples will be in great demand next year he may invest in an orchard to grow apples for sale next year. During the year, while his apples are growing, he may ignore the day-to-day price changes of apples because his focus is on next year.
The trader doesn’t care to be part of anything other than the enterprise of making money. If he thinks orchards will increase in price next week, he’ll buy an orchard. He doesn’t care about orchards or apples. He’d buy a worm farm today if he thought he could turn a dime on it next week. He is very concerned about day-to-day price fluctuations since it is the past behavior of prices that make him expect the price to go up next week.
If the belief in the future value of apples is shaken then some of the orchard investors may decide that running an orchard isn’t the best choice. They abandon the business. Other investors see the cost of orchards dropping and, at some price point, believe that the now lower cost of orchards justifies the apple business given the reduced future price of apples. They start buying orchards.
This doesn’t happen all at once. Not everyone agrees with the amount that the price of apples will drop by. Because of this, different people see different price points as being good times to get back into the apple business.
The investor uses fundamental analysis to make his decisions, but what is the trader doing?
The trader is watching the patterns in the price of orchards and how frequently orchards are changing ownership as the prices go up or down. Eventually the pattern looks like a pattern that he has seen many times before and it usually occurs when prices have finished dropping and they are about to start escalating. Based on this, he decides to buy an orchard. He will hold that orchard until he thinks that he sees a pattern that suggests that the price of orchards will stop going up. He then sells the orchard. He has used technical analysis.
The trader’s technical analysis would be worthless without investors doing their fundamental analysis. Without the investors, there would be no patterns to watch for. It is the investors making their decisions based on fundamental analysis that creates the pricing patterns that the technical trader watches. The pricing pattern that indicates a bottoming in prices occurs when the price falls far enough to start attracting a large number of investors.
In the end, neither is better. Both technical and fundamental analysis help to create an efficient marketplace that can deliver goods to the consumer.
I refer to users of technical analysis as traders and users of fundamental analysis as investors. Their time horizons usually differ. Traders look to get in and out of a trade in hours, days, weeks, and sometimes months. Investors usually get in for months to years.
If you have a strong belief that something is going to happen and you are in the minority then you have an excellent opportunity to make a lot of money by investing in companies that stand to profit from that eventuality. Those profits won’t materialize until you are no longer in the minority. As more and more people start to share your belief, the prices of those companies will rise and you can profit handsomely. While you are waiting for others to start sharing your beliefs, the prices of those companies may go up and down. As long as your belief isn’t swayed you may bear those price swings secure in the knowledge of what is to come. You are an investor. On the other hand, if you’re wrong…
An example may be a belief that there will be water shortages resulting from global warming. Believing this, you may decide to invest part of your money in companies that build desalinization plants. You believe that, over the next 10-15 years, these companies’ products will see soaring demand. Secure in the belief that this will occur, you will not be terribly concerned if the price of one of those companies drops 5 percent next month. You believe that it will recover and then some. You are basing your decision on fundamental analysis.
The above is fundamental analysis on a macro economic scale. Bringing fundamental analysis to bear on a company-by-company basis is much more difficult. Numerous data points need to be entered, many of which are not available as hard data but rely on assumptions made by the person performing the fundamental analysis. One type of fundamental analysis called Discounted Cash Flow (DCF) is currently very popular. It involves formulas that take operating profit, depreciation, amortization, goodwill, capital expenditures, cash taxes, changes in working capital, and weighted average cost of capital, to arrive at a valuation for a company (see http://www.investopedia.com/articles/03/011403.asp for more detail).
Just collecting the data needed to perform the analysis for a single company can be a daunting task. Performing this kind of analysis on a large number of companies on a regular basis quickly becomes a full time job.
The trader on the other hand can use computers to scan for likely candidates for the pricing patterns that he uses. Within minutes a computer can download data on thousands of stocks and have the computer bring up relatively short lists of stocks that are potential candidates for trades.
A trader may also use technical analysis on the market as a whole to move money back and forth between an index fund and a money market fund. One simple way to do this is by using the market breadth.
Market breadth is simply a measure of the difference between the number of advancing issues and the number of declining issues on an exchange such as the NYSE. If 1200 stocks go up in price and 500 go down in price then the breadth is +700. We can calculate this number every day and then look for trends by calculating moving averages of these numbers. A good way to get long term directional movements is to analysis how two different moving averages changes relative to each other. The name for that practice is called Moving Average Convergence Divergence or MACD. If we apply MACD to the breadth using a 19-day and a 39-day moving average then we get a well-known indicator called the McClellan Summation Index (MSI).

Figure 1: MSI courtesy of StockCharts.com
If we look at the SP-500 for the same time frame
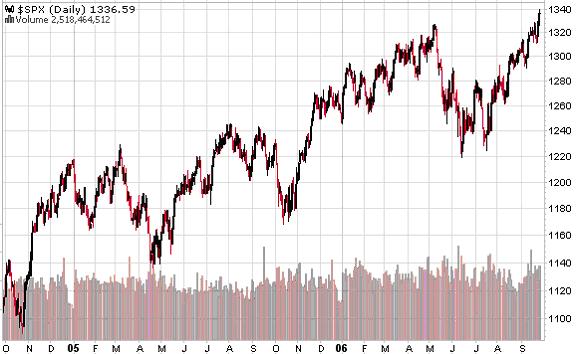
Figure 2: SP-500 courtesy of Stockcharts.com
If you had bought and sold an index fund based on the MSI peaks and valleys then you would have made the following trades (numbers and dates approximated)
Purchase date Cost Sales Date Price Profit/(Loss)
Late April ‘05 $1140 Late July ‘05 $1240 8.5%
Late Oct ‘05 $1180 Late Jan ‘06 $1280 8.5%
Late June ‘06 $1240 Late Sept ‘06 $1335 7.5%
You would have been in the market for 9 out of the last 17 months. While in the market you would have realized a 24.5% return plus the money market interest earned during the other 8 months, lets say 2.5%. That works out to a 19% annualized return (27*(12/17)).
How do you know when the MSI is at a peak or a valley? I use the MACD of the MSI with the averages being 30-day and 50-day. This smoothes out the action of the MSI and clearly shows the overall direction that it is moving in.
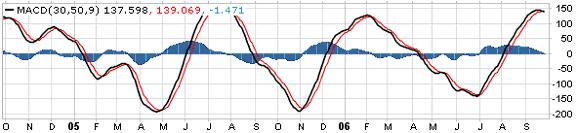
Figure 3: MACD of MSI courtesy of Stockcharts.com
The black line on the graph is a 9-day moving average of the red line. The red line is the MACD. The histogram shows the difference between the red and black line. The buy signal is when the MSI falls below –300 and the black line crosses up over the red line as it did in late Apr ’05, early Nov ’05, and late June ’06. The sell signal is when the MSI rises above +500 and the black line falls under the red line as it did in late July ’05, early Feb ’06, and late Sept ’06.
This indicator is not perfect at picking tops and bottoms. It is good at warning when the breadth of the market is no longer supportive of the direction of the market. The market usually changes direction shortly after that occurs. In the spring of ’06, this indicator was falling while the market indexes were advancing for an unusually long time. This meant that the number of stocks participating in the market move was dropping off. Fewer and fewer stocks were trading above their 40-day moving averages each week even as the SP-500 moved upward.
There are numerous technical indicators in use and there are many good books that discuss these indicators in depth. One such book is “New Trading Systems and Methods” by Perry J Kaufman. There are also computer programs that can be purchased that have many of these indictors built in such as TC2005 from Worden Bros (www.worden.com). There are also websites that have many of these indicators built in and some on-line brokers have charting packages containing some of the indicators.
The extreme in technical analysis is called Mechanical Trading. In mechanical trading a computer has extensively tested a set of indicators over numerous sets of historical data to arrive at an “ideal” set of indicators which the computer uses to issue buy and sell recommendations completely without any human intervention. My website, www.statisticaltrading.com, allows people to subscribe to computer generated buy and sell recommendations. Our computers have honed sets of technical indicators that have over 83% success rates with average holding times of 5-6 weeks. All recommendations come in the evening for execution at the next morning’s open; there is no day trading support on the site. We also offer a market timing service and a dividend investing service.
No comments:
Post a Comment