Almost Family, Inc. (AFAM)
Almost Family, Inc. and its subsidiaries provide home health nursing services. It operates through two segments Visiting Nurse and Personal Care. The Visiting Nurse segment provides medical services in patients' homes. The Personal Care segment provides personal care services in patients' homes. The company has service locations in Kentucky, Florida, Maryland, Ohio, Connecticut, Massachusetts, Alabama, and Indiana. Almost Family was formerly known as Caretenders HealthCorp and changed its name to Almost Family, Inc. in 2000. The company was incorporated in 1985 and is based in Louisville, Kentucky.
The few things I like about this one is the low P/E, and honestly, it's has the lowest out of all it's direct competitors. Through on top of that it has a Qtrly Rev Growth (yoy) of 13.80% and still going!
The only thing that we can not figure out is that. Someone is behind all this, because for all the numbers and key stats. I mean it's a great story, good solid numbers, but is just stuck. We just can not understand why this one has not taken off yet. Though, we feel that it could somewhere down the road. AFAM might be one to watch!
Wednesday, November 08, 2006

Friday, November 03, 2006
Stock Market Guarantee
Stock Market Guarantee
Helium is up.
Feathers were down.
Paper was stationary.
Fluorescent tubing was dimmed in light trading.
Knives were up sharply.
Cows steered into a bull market.
Pencils lost a few points.
Hiking equipment was trailing.
Elevators rose, while escalators continued their slow decline.
Weights were up in heavy trading.
Light switches were off.
Mining equipment hit rock bottom.
Diapers remained unchanged.
Shipping lines stayed at an even keel.
The market for raisins dried up.
Coca-Cola fizzled.
Caterpillar stock inched up a bit.
Sun peaked at midday.
Balloon prices were inflated.
Scott Tissue touched a new bottom.
And batteries exploded in an attempt to recharge the market.
Helium is up.
Feathers were down.
Paper was stationary.
Fluorescent tubing was dimmed in light trading.
Knives were up sharply.
Cows steered into a bull market.
Pencils lost a few points.
Hiking equipment was trailing.
Elevators rose, while escalators continued their slow decline.
Weights were up in heavy trading.
Light switches were off.
Mining equipment hit rock bottom.
Diapers remained unchanged.
Shipping lines stayed at an even keel.
The market for raisins dried up.
Coca-Cola fizzled.
Caterpillar stock inched up a bit.
Sun peaked at midday.
Balloon prices were inflated.
Scott Tissue touched a new bottom.
And batteries exploded in an attempt to recharge the market.
Wednesday, November 01, 2006
Value of Time - this will help you value life, time, friends, family and etc! What's it really worth to you?
Value of Time - this will help you value not stocks or money but may it help you think about life, time, friends, family and etc! What's it really worth to you?
Imagine there is a bank that credits your account each morning with $86,400.
It carries over no balance from day to day.
Every evening deletes whatever part of the balance you failed to use
during the day.
What would you do? Draw out every cent, of course!
Each of us has such a bank. Its name is TIME.
Every morning, it credits you with 86,400 seconds.
Every night it writes off, as lost, whatever of this you have failed
to invest to good purpose.
It carries over no balance.
It allows no overdraft.
Each day it opens a new account for you.
Each night it burns the remains of the day.
If you fail to use the day's deposits, the loss is yours.
There is no going back. There is no drawing against the "tomorrow".
You must live in the present on today's deposits.
Invest it so as to get from it the utmost in health, happiness and success!
The clock is running. Make the most of today.
To realize the value of ONE YEAR, ask a student who failed a grade.
To realize the value of ONE MONTH, ask a mother who gave birth to a
pre-mature baby.
To realize the value of ONE WEEK, ask the editor of a weekly newspaper.
To realize the value of ONE DAY, ask a daily wage laborer with kids to feed.
To realize the value of ONE HOUR, ask the lovers who are waiting to meet.
To realize the value of ONE MINUTE, ask a person who missed the train.
To realize the value of ONE SECOND, ask a person who just avoided an accident.
To realize the value of ONE MILLI-SECOND, ask the person who won a
silver medal in the Olympics.
Treasure every moment that you have! And treasure it more because you
shared it with someone special, special enough to spend your time.
And remember that time waits for no one.
Yesterday is history.
Tomorrow a mystery.
Today is a gift.
That's why it's called the present!
Imagine there is a bank that credits your account each morning with $86,400.
It carries over no balance from day to day.
Every evening deletes whatever part of the balance you failed to use
during the day.
What would you do? Draw out every cent, of course!
Each of us has such a bank. Its name is TIME.
Every morning, it credits you with 86,400 seconds.
Every night it writes off, as lost, whatever of this you have failed
to invest to good purpose.
It carries over no balance.
It allows no overdraft.
Each day it opens a new account for you.
Each night it burns the remains of the day.
If you fail to use the day's deposits, the loss is yours.
There is no going back. There is no drawing against the "tomorrow".
You must live in the present on today's deposits.
Invest it so as to get from it the utmost in health, happiness and success!
The clock is running. Make the most of today.
To realize the value of ONE YEAR, ask a student who failed a grade.
To realize the value of ONE MONTH, ask a mother who gave birth to a
pre-mature baby.
To realize the value of ONE WEEK, ask the editor of a weekly newspaper.
To realize the value of ONE DAY, ask a daily wage laborer with kids to feed.
To realize the value of ONE HOUR, ask the lovers who are waiting to meet.
To realize the value of ONE MINUTE, ask a person who missed the train.
To realize the value of ONE SECOND, ask a person who just avoided an accident.
To realize the value of ONE MILLI-SECOND, ask the person who won a
silver medal in the Olympics.
Treasure every moment that you have! And treasure it more because you
shared it with someone special, special enough to spend your time.
And remember that time waits for no one.
Yesterday is history.
Tomorrow a mystery.
Today is a gift.
That's why it's called the present!
Friday, October 27, 2006
How much do I initially have to invest?
How much do I initially have to invest? How much can I afford to consistently add later?
Einstein described compounding as “The Eighth Wonder of the World” and for good reason. Being able to earn interest on your interest allows investments to increase exponentially faster than with simple interest. A one-time investment of $5000 earning 10% interest compounds to a total of over $54,000 after 25 years. Using simple interest, it would take over 95 years to reach the same amount. Naturally, the larger your initial investment and the more you can afford to add later on, the more you can expect to gain in returns.
Am I carrying any high-interest debt, such as on a credit card?
Before saving for future events, you should consider your present finances. Paying off any high-interest loans function as an “automatic” return. Writing a check to Visa to pay down your debt may not feel as satisfying as starting a nest egg, but by eliminating those 22% interest payments, you have effectively “made” a 22% return. Although you need not completely eliminate your debts, getting such payments into a reasonable area should be a more pressing priority.
This fiscal reckoning is also a good time to examine budgeting and expenditures. Look for unneeded or overpriced purchases, and consider the feasibility of paring them down and saving the extra money. Unused gym memberships, that $5 whipped mocha-hazelnut cappuccino, and extra cable channels all add up. The true cost of these and all other purchases involves understanding the “time value of money”, but for now it should suffice to say that $5 added to the previously mentioned investment account compounding 10% for 25 years turns into $54.17.
What is my risk tolerance? What is my investing style?
This question leads us to selecting individual investments. Consider your investment timetable for when you’ll need the money, recognizing that more conservative selections should be made the shorter the window. Everyone’s risk tolerance is different; while one person may feel comfortable with small-cap biotechs another may need a blue chip to feel equally sound.
Analyzing the risk to reward ratio here is a good first step. The more risk you take on, the more you should expect to get in return if your investment pays off. The inverse is also true: the more stable an investment, the less return one should expect. Government-backed I Bonds pay over 6%, but involve tying up money for years in order to fully benefit from them. While this gives you one target, the average return of the broader market indices is about 11% per year. There are two primary schools of thought about investing: growth and value.
Growth
Growth investing is a higher-risk strategy which focuses on finding smaller companies poised to rapidly grow earnings. Stocks here tend to be micro-caps or small-caps, and the occasional mid-cap (under $10 billion). In their younger lives, many of the well-established companies of today found themselves considered here (Think of Apple Computers (AAPL) or Starbucks (SBUX)). Growth companies can be found in many different sectors, although such companies often have similar traits. A growth company usually has a unique product or service to offer which can fundamentally change how business is done. When found early enough in their growth cycles, these companies have the potential to return enormous profits to investors.
Value
Value plays usually are found in larger companies, although the strategies used to find them can be applied to smaller corporations as well. Looking for value stocks is similar to looking for values in a store: find a good product at a price below what you would normally expect to pay. These bargains are often found in the form of companies which have been unfairly beaten down through overselling. Finding value stocks usually involves using a discounted cash flow model (DCF) to find a company’s intrinsic value. This is the form of investing advocated by Benjamin Graham, and popularized by Warren Buffett.
GARP
GARP, or Growth At Reasonable Price, is a combination of the above forms. As the name implies, the focus is finding growing companies trading at reasonable prices. Quick measures of this include the PEG ratio (Price to Earnings to Growth) and Forward P/E. Although not a specific style, GARP is utilized by many investors because of its flexibility. The average, diversified portfolio will have many GARP-type stocks in it.
Getting Started: Learning the Market and Selecting Stocks
If you were going to spend several thousand dollars on a refrigerator or television, you would thoroughly research the market for those goods to find the product which best suited your needs. Investing is no different. Before buying into a company, you should be well-acquainted enough with it to give a short presentation. Knowing the basics of how a company operates, what it sells, how it makes money, how much money it makes, and what kind of growth the company is expected to experience are all crucial questions that any investor should be able to answer. Developing a better understanding of the stock market is a long, but hopefully rewarding, process.
Immediately investing in stocks with real money, however, is equivalent to taking a test without being introduced to the material. Formerly called “paper trading”, beginning investors would normally spend several months tracking their stock picks without having real money on them. Thanks to technology, you can now find sites that automate (for free) the process of tracking price changes for you on the internet. Simulated investing is a risk-free way of beginning to understand market fluctuations and the forces driving them.
Examining these trends will payoff in the future, as an increased understanding of the stock market can only help you on your path to building wealth. Once you become comfortable picking your own stocks, you can still continue to “paper trade” online, as it offers the opportunity to explore and experiment with other investing styles. Gordon Gekko, the famed villain in Wall Street played by Michael Douglas, said “Information is the most valuable commodity I know of”. Ignoring for a moment that the movie ended with indictments for insider trading, the statement is true: you will not regret being an informed and intelligent investor. The market is constantly changing, but by learning the ropes of investing you too can pull off a “One Up on Wall Street”.
Einstein described compounding as “The Eighth Wonder of the World” and for good reason. Being able to earn interest on your interest allows investments to increase exponentially faster than with simple interest. A one-time investment of $5000 earning 10% interest compounds to a total of over $54,000 after 25 years. Using simple interest, it would take over 95 years to reach the same amount. Naturally, the larger your initial investment and the more you can afford to add later on, the more you can expect to gain in returns.
Am I carrying any high-interest debt, such as on a credit card?
Before saving for future events, you should consider your present finances. Paying off any high-interest loans function as an “automatic” return. Writing a check to Visa to pay down your debt may not feel as satisfying as starting a nest egg, but by eliminating those 22% interest payments, you have effectively “made” a 22% return. Although you need not completely eliminate your debts, getting such payments into a reasonable area should be a more pressing priority.
This fiscal reckoning is also a good time to examine budgeting and expenditures. Look for unneeded or overpriced purchases, and consider the feasibility of paring them down and saving the extra money. Unused gym memberships, that $5 whipped mocha-hazelnut cappuccino, and extra cable channels all add up. The true cost of these and all other purchases involves understanding the “time value of money”, but for now it should suffice to say that $5 added to the previously mentioned investment account compounding 10% for 25 years turns into $54.17.
What is my risk tolerance? What is my investing style?
This question leads us to selecting individual investments. Consider your investment timetable for when you’ll need the money, recognizing that more conservative selections should be made the shorter the window. Everyone’s risk tolerance is different; while one person may feel comfortable with small-cap biotechs another may need a blue chip to feel equally sound.
Analyzing the risk to reward ratio here is a good first step. The more risk you take on, the more you should expect to get in return if your investment pays off. The inverse is also true: the more stable an investment, the less return one should expect. Government-backed I Bonds pay over 6%, but involve tying up money for years in order to fully benefit from them. While this gives you one target, the average return of the broader market indices is about 11% per year. There are two primary schools of thought about investing: growth and value.
Growth
Growth investing is a higher-risk strategy which focuses on finding smaller companies poised to rapidly grow earnings. Stocks here tend to be micro-caps or small-caps, and the occasional mid-cap (under $10 billion). In their younger lives, many of the well-established companies of today found themselves considered here (Think of Apple Computers (AAPL) or Starbucks (SBUX)). Growth companies can be found in many different sectors, although such companies often have similar traits. A growth company usually has a unique product or service to offer which can fundamentally change how business is done. When found early enough in their growth cycles, these companies have the potential to return enormous profits to investors.
Value
Value plays usually are found in larger companies, although the strategies used to find them can be applied to smaller corporations as well. Looking for value stocks is similar to looking for values in a store: find a good product at a price below what you would normally expect to pay. These bargains are often found in the form of companies which have been unfairly beaten down through overselling. Finding value stocks usually involves using a discounted cash flow model (DCF) to find a company’s intrinsic value. This is the form of investing advocated by Benjamin Graham, and popularized by Warren Buffett.
GARP
GARP, or Growth At Reasonable Price, is a combination of the above forms. As the name implies, the focus is finding growing companies trading at reasonable prices. Quick measures of this include the PEG ratio (Price to Earnings to Growth) and Forward P/E. Although not a specific style, GARP is utilized by many investors because of its flexibility. The average, diversified portfolio will have many GARP-type stocks in it.
Getting Started: Learning the Market and Selecting Stocks
If you were going to spend several thousand dollars on a refrigerator or television, you would thoroughly research the market for those goods to find the product which best suited your needs. Investing is no different. Before buying into a company, you should be well-acquainted enough with it to give a short presentation. Knowing the basics of how a company operates, what it sells, how it makes money, how much money it makes, and what kind of growth the company is expected to experience are all crucial questions that any investor should be able to answer. Developing a better understanding of the stock market is a long, but hopefully rewarding, process.
Immediately investing in stocks with real money, however, is equivalent to taking a test without being introduced to the material. Formerly called “paper trading”, beginning investors would normally spend several months tracking their stock picks without having real money on them. Thanks to technology, you can now find sites that automate (for free) the process of tracking price changes for you on the internet. Simulated investing is a risk-free way of beginning to understand market fluctuations and the forces driving them.
Examining these trends will payoff in the future, as an increased understanding of the stock market can only help you on your path to building wealth. Once you become comfortable picking your own stocks, you can still continue to “paper trade” online, as it offers the opportunity to explore and experiment with other investing styles. Gordon Gekko, the famed villain in Wall Street played by Michael Douglas, said “Information is the most valuable commodity I know of”. Ignoring for a moment that the movie ended with indictments for insider trading, the statement is true: you will not regret being an informed and intelligent investor. The market is constantly changing, but by learning the ropes of investing you too can pull off a “One Up on Wall Street”.
Tuesday, October 24, 2006
10 things the new kid on wall street needs to know
10 so you want to play the stocks kid! Well, gather around and let us share 10 things that we have learned to stick this game out for the long haul.
Being a new kid on the block of investing is a lot like being a small fish in a big pond. The new adventure of a big pond can be scary, adventure, and fun. Some keys for the new kid on wall street would be:
1) Learn to make your own decisions.
Everyone will give you advice. Most of it is worthless. You need to make your own investment decisions. It’s your money, and believe me, no one cares if you lose it. In fact, many are rooting for you to, because they want to make money off you.
2) Never blindly trust information.
You need to independently confirm every thing you hear about a stock or a company. Through good solid research yourself. People will lie, because they stand to make a ton of money from stock sales. They’ll gladly mis-represent information, so insist on looking at the real thing, real facts, and real research.
3) Do the work and understand what you’re buying.
Stock investing a fairly complex topic. It could take you many months or even years to master the basics. Mastering the basics is what you need to be concerned with. If you really thing there’s a fast buck coming your way, you need to wise up. One key that we always want to state is always investing thinking long term. Not to many people win short term though it can be done it's done by the experts!
4) Develop a trading style or system.
Don't just make up a system, but research systems, so what others do and continue to do. But, then make some small changes and make your own unique system. Don’t always base all your ideas from other famous people’s systems. In every system has it's strengths and weakness. There is no peferct system to get rich fast. A key is to come up with your own personalized investing methods and systems that work for you, your budget, your personality.
5) Ignore “HOT STOCK TIPS”.
Most hot stock tips are SCAMS!! If they were as hot as Shakira, then they would be implemented by the person who has them. The only information about investing that’s released to the masses is outdated.
6) Most people who recommend stocks do so because they have a financial inducement.
Really, just be real with yourself. Don't be so silly to really think that recommendations are just that. In the real investing world rarely are these stock or investing recommendations are not done free. Please not that most of the time the recommendations come after many, the inside guys, etc have already purchased at a lower price then what you would be getting in at.
7) Concentrate investing with a focus.
Don't go read and learn everything you can about every company or stock. You would be better off starting with a trend, or familiar with a few stocks and really research them down to the penny. Again, ALWAYS stick to your guns aka your investing plan, your investing style, and your investing strategy!
8) You need to put big money to see big profits.
Don't go quitting your day job on $5k of capital. It’s not that much money,
BUDDY! You would need a big bankroll to make decent money. This is true, but don't get the wrong idea as well. It's okay to start of with only $5k in starting a good solid investment focus. Balance is a the key, don't go to one extreme of not investing or the other extreme of quitting your day job to become a day trader on $5k of capital.
9) Don’t over due it on the diversifying or put away too much money into too many stocks.
If you do, you can expect to have a hard time getting good solid returns. If you start with a small amount of cash, you need to concentrate in one stock or few stocks to have the best result. Wait until you get some experience, some research, and before you go jumping into the deep end of the stock market.
10) Use stop losses.
Don’t ever lose more than we suggest 8% others might say 10% on any trade. If you use a stop-loss, you can guarantee that your downside is never less than 8% to 10%. This could save you in the event of a free fall. Also, a major key in this to, is to be discipline enough to keep putting in those stop losses even when the stock goes up. So say if your stock has gone up 15% well put a stop loss of a new 8% based on the 15% gain! This is discipline, but that's what it take in investing and in life!
Being a new kid on the block of investing is a lot like being a small fish in a big pond. The new adventure of a big pond can be scary, adventure, and fun. Some keys for the new kid on wall street would be:
1) Learn to make your own decisions.
Everyone will give you advice. Most of it is worthless. You need to make your own investment decisions. It’s your money, and believe me, no one cares if you lose it. In fact, many are rooting for you to, because they want to make money off you.
2) Never blindly trust information.
You need to independently confirm every thing you hear about a stock or a company. Through good solid research yourself. People will lie, because they stand to make a ton of money from stock sales. They’ll gladly mis-represent information, so insist on looking at the real thing, real facts, and real research.
3) Do the work and understand what you’re buying.
Stock investing a fairly complex topic. It could take you many months or even years to master the basics. Mastering the basics is what you need to be concerned with. If you really thing there’s a fast buck coming your way, you need to wise up. One key that we always want to state is always investing thinking long term. Not to many people win short term though it can be done it's done by the experts!
4) Develop a trading style or system.
Don't just make up a system, but research systems, so what others do and continue to do. But, then make some small changes and make your own unique system. Don’t always base all your ideas from other famous people’s systems. In every system has it's strengths and weakness. There is no peferct system to get rich fast. A key is to come up with your own personalized investing methods and systems that work for you, your budget, your personality.
5) Ignore “HOT STOCK TIPS”.
Most hot stock tips are SCAMS!! If they were as hot as Shakira, then they would be implemented by the person who has them. The only information about investing that’s released to the masses is outdated.
6) Most people who recommend stocks do so because they have a financial inducement.
Really, just be real with yourself. Don't be so silly to really think that recommendations are just that. In the real investing world rarely are these stock or investing recommendations are not done free. Please not that most of the time the recommendations come after many, the inside guys, etc have already purchased at a lower price then what you would be getting in at.
7) Concentrate investing with a focus.
Don't go read and learn everything you can about every company or stock. You would be better off starting with a trend, or familiar with a few stocks and really research them down to the penny. Again, ALWAYS stick to your guns aka your investing plan, your investing style, and your investing strategy!
8) You need to put big money to see big profits.
Don't go quitting your day job on $5k of capital. It’s not that much money,
BUDDY! You would need a big bankroll to make decent money. This is true, but don't get the wrong idea as well. It's okay to start of with only $5k in starting a good solid investment focus. Balance is a the key, don't go to one extreme of not investing or the other extreme of quitting your day job to become a day trader on $5k of capital.
9) Don’t over due it on the diversifying or put away too much money into too many stocks.
If you do, you can expect to have a hard time getting good solid returns. If you start with a small amount of cash, you need to concentrate in one stock or few stocks to have the best result. Wait until you get some experience, some research, and before you go jumping into the deep end of the stock market.
10) Use stop losses.
Don’t ever lose more than we suggest 8% others might say 10% on any trade. If you use a stop-loss, you can guarantee that your downside is never less than 8% to 10%. This could save you in the event of a free fall. Also, a major key in this to, is to be discipline enough to keep putting in those stop losses even when the stock goes up. So say if your stock has gone up 15% well put a stop loss of a new 8% based on the 15% gain! This is discipline, but that's what it take in investing and in life!
Friday, October 20, 2006
Headwaters (HW)
Adding value to energy… and possibly your portfolio.
By eInvesting.com
Value investing involves finding a discrepancy between the price of a security and the value of the underlying company. Some people criticize value investing as boring or too prone to overlooking growth opportunities. But what happens if a solid, cash producing business was integrated with a research group intent on finding synergies to generate additional earnings from current operations, and also on finding important new breakthroughs to fuel growth further down in the company’s life?
That company would be Headwaters (ticker: HW), which has three distinct operating divisions - construction materials, coal, and alternative energy. Before I get into valuation, here is an overview of Headwaters’ various segments.
The materials unit currently makes up a majority of earnings and revenues, and involvement in that industry was management's decision to diversify the more risky and cyclical energy operations which offer most of the growth potential. While revenues have undoubtedly been raised by the housing construction boom, only about one-third of Headwaters sales in the area are for new housing construction, so any decrease in revenues and earnings because of fewer housing starts should be minimal. Wisely, there are already some synergies within the company because Headwaters converts used coal into concrete additives and synthetic stone. The use of fly ash-based concrete reduces atmospheric pollution, and as such is endorsed by the federal government and all fifty states for government contracts. Fly ash is also finding its way into mortars and stuccos, which Headwaters sells. Over the last few years, Headwaters has been making capital expenditures to expand its distribution network and establish itself in the field of building supplies. The conservative scenario is for Headwaters to keep capital expenditures in-line with revenues and earnings, so no marginal decrease in free cash flow rates should occur from the Materials division. Look for solid earnings and consistent growth.
The coal division is involved in coal combustion and by-product utilization (see above). Headwaters makes using coal inherently more efficient, and then also finds ways to add value to the byproducts after it has been used to produce energy. Coal remains a cheap, easy way to generate power and with the volatile and increasingly expensive, coal will become even more important in generating energy, both in America and around the globe. There are over 150 proposed coal-fired plants in the U.S. (not to mention hundreds more in other parts of the world), and environmental groups, while usually unable to stop construction, can at least get laws applied to make the coal “cleaner”. Headwaters is perfectly positioned for such a trend, offering both emissions control should coal be burned and is developing coal-to-liquids technology to allow for the creation of synthetic crude oil or natural gas from coal.
Considering that approximately 95% of America’s energy production capacity comes from coal, an amount significantly greater than can be found in the oil reserves of the Middle East, the uses for coal, and coal-to-liquids technology, seem abundant.
The final and most dynamic division is the Technology and Innovation unit, which does research in the alternative energy and heavy-oil areas. For everything you hear about the Canadian oil sands, regular refiners have enough problems handling and grade worse than light, sweet crude. As the remaining supplies of light, sweet crude are extracted, eventually more inferior grades will need to be refined… all the way to tar sands, which is proving the most difficult to handle. Headwaters’ (HC)3 Hydrocracking technology allows for heavy oil to be upgraded to more easily refined grades. Additionally, Hydrocracking can be used on low quality distillates remaining after the initial refining to turn them into higher-value petroleum products. A quick value-added calculation shows that it could easily be a multi-billion dollar addition to the economy, and if Headwaters' maintains its standard operating margin of 11% on it (not to say that it couldn't be higher, but I'm being conservative) it could double earnings just from capturing the upgrading market. If HC3 gained wider use as light oil blends decline and refiners increasingly switch to heavy oil, that could add even more to the bottom line. The high-side estimate for "upgrading" profits is about $600 million. Such a number does not include any profits to be made from applying Hydrocracking technology to the Canadian Tar Sands, as for now that is still too speculative to count on as a potential future revenue.
Headwaters is also involved in nanotechnology and fuel cell research, with numerous potential applications. Their proprietary NxCat nanotechnology is claimed to be the most efficient nanoagent created, outperforming today’s standard catalysts. More uses are being tested involving hydrogen peroxide production, LED displays, and carbon nanotubes. These potential breakthrough, while difficult to value directly, should be treated like having a free call option on an exciting and potentially lucrative future investment.
Current financial status and valuation: Headwaters has had a rough several months, with the rise in oil prices leading to a phasing out of tax credits benefiting some of Headwaters synthetic fuel catalysts. Headwaters has gone from $40 to near $20 back to $25 in the last few months as analysts have cut short term earnings estimates. Having become interested in this stock the first time it traded down through $25, I will admit to becoming bullish too soon and trying to “catch the falling knife”. The stock has begun to swing back up on some positive news, and buying now will mean that, although you missed the first 20% of the move, there could still be plenty of profit ahead.
For a company capitalized at just over $1 billion to have a trailing twelve month free cash flow of $150 million is amazing. HW does have about $500 million in debt, but I'm not too concerned about that because of the large cash flows which can be used to pay that down. They have cut total outstanding debt by 30% since the end of 2004, and the SEC filings say that Headwaters is prohibited from paying a dividend until it has no outstanding long-term liabilities. As long as Headwaters continues to pull in so much cash, their debt position should be no problem. Taking into all the above factors, if the company can eke out a moderate growth in the high single digit range over the next few years, a conservative exit multiple off that free cash flow makes HW undervalued by 35% - or about $35 per share. When you think of the huge potential gains down the road from the many growth areas the company has, its easy to see how this could be a $40 or even $50 stock sometime in the next year or two.
eInvesting.com is a free stock market simulator and forum. The author has no financial position in any stocks mentioned.
By eInvesting.com
Value investing involves finding a discrepancy between the price of a security and the value of the underlying company. Some people criticize value investing as boring or too prone to overlooking growth opportunities. But what happens if a solid, cash producing business was integrated with a research group intent on finding synergies to generate additional earnings from current operations, and also on finding important new breakthroughs to fuel growth further down in the company’s life?
That company would be Headwaters (ticker: HW), which has three distinct operating divisions - construction materials, coal, and alternative energy. Before I get into valuation, here is an overview of Headwaters’ various segments.
The materials unit currently makes up a majority of earnings and revenues, and involvement in that industry was management's decision to diversify the more risky and cyclical energy operations which offer most of the growth potential. While revenues have undoubtedly been raised by the housing construction boom, only about one-third of Headwaters sales in the area are for new housing construction, so any decrease in revenues and earnings because of fewer housing starts should be minimal. Wisely, there are already some synergies within the company because Headwaters converts used coal into concrete additives and synthetic stone. The use of fly ash-based concrete reduces atmospheric pollution, and as such is endorsed by the federal government and all fifty states for government contracts. Fly ash is also finding its way into mortars and stuccos, which Headwaters sells. Over the last few years, Headwaters has been making capital expenditures to expand its distribution network and establish itself in the field of building supplies. The conservative scenario is for Headwaters to keep capital expenditures in-line with revenues and earnings, so no marginal decrease in free cash flow rates should occur from the Materials division. Look for solid earnings and consistent growth.
The coal division is involved in coal combustion and by-product utilization (see above). Headwaters makes using coal inherently more efficient, and then also finds ways to add value to the byproducts after it has been used to produce energy. Coal remains a cheap, easy way to generate power and with the volatile and increasingly expensive, coal will become even more important in generating energy, both in America and around the globe. There are over 150 proposed coal-fired plants in the U.S. (not to mention hundreds more in other parts of the world), and environmental groups, while usually unable to stop construction, can at least get laws applied to make the coal “cleaner”. Headwaters is perfectly positioned for such a trend, offering both emissions control should coal be burned and is developing coal-to-liquids technology to allow for the creation of synthetic crude oil or natural gas from coal.
Considering that approximately 95% of America’s energy production capacity comes from coal, an amount significantly greater than can be found in the oil reserves of the Middle East, the uses for coal, and coal-to-liquids technology, seem abundant.
The final and most dynamic division is the Technology and Innovation unit, which does research in the alternative energy and heavy-oil areas. For everything you hear about the Canadian oil sands, regular refiners have enough problems handling and grade worse than light, sweet crude. As the remaining supplies of light, sweet crude are extracted, eventually more inferior grades will need to be refined… all the way to tar sands, which is proving the most difficult to handle. Headwaters’ (HC)3 Hydrocracking technology allows for heavy oil to be upgraded to more easily refined grades. Additionally, Hydrocracking can be used on low quality distillates remaining after the initial refining to turn them into higher-value petroleum products. A quick value-added calculation shows that it could easily be a multi-billion dollar addition to the economy, and if Headwaters' maintains its standard operating margin of 11% on it (not to say that it couldn't be higher, but I'm being conservative) it could double earnings just from capturing the upgrading market. If HC3 gained wider use as light oil blends decline and refiners increasingly switch to heavy oil, that could add even more to the bottom line. The high-side estimate for "upgrading" profits is about $600 million. Such a number does not include any profits to be made from applying Hydrocracking technology to the Canadian Tar Sands, as for now that is still too speculative to count on as a potential future revenue.
Headwaters is also involved in nanotechnology and fuel cell research, with numerous potential applications. Their proprietary NxCat nanotechnology is claimed to be the most efficient nanoagent created, outperforming today’s standard catalysts. More uses are being tested involving hydrogen peroxide production, LED displays, and carbon nanotubes. These potential breakthrough, while difficult to value directly, should be treated like having a free call option on an exciting and potentially lucrative future investment.
Current financial status and valuation: Headwaters has had a rough several months, with the rise in oil prices leading to a phasing out of tax credits benefiting some of Headwaters synthetic fuel catalysts. Headwaters has gone from $40 to near $20 back to $25 in the last few months as analysts have cut short term earnings estimates. Having become interested in this stock the first time it traded down through $25, I will admit to becoming bullish too soon and trying to “catch the falling knife”. The stock has begun to swing back up on some positive news, and buying now will mean that, although you missed the first 20% of the move, there could still be plenty of profit ahead.
For a company capitalized at just over $1 billion to have a trailing twelve month free cash flow of $150 million is amazing. HW does have about $500 million in debt, but I'm not too concerned about that because of the large cash flows which can be used to pay that down. They have cut total outstanding debt by 30% since the end of 2004, and the SEC filings say that Headwaters is prohibited from paying a dividend until it has no outstanding long-term liabilities. As long as Headwaters continues to pull in so much cash, their debt position should be no problem. Taking into all the above factors, if the company can eke out a moderate growth in the high single digit range over the next few years, a conservative exit multiple off that free cash flow makes HW undervalued by 35% - or about $35 per share. When you think of the huge potential gains down the road from the many growth areas the company has, its easy to see how this could be a $40 or even $50 stock sometime in the next year or two.
eInvesting.com is a free stock market simulator and forum. The author has no financial position in any stocks mentioned.
Thursday, October 19, 2006
Escala Group Inc. (ESCL)
Escala Group Inc. (ESCL)
ABOUT ESCALA GROUP
Escala Group is a global federation of leading companies in the collectibles market with operations in North America, Europe and Asia as well as on the Internet. The company operates through a number of subsidiaries that specialize in various sectors of the collectibles markets, and is comprised of three business areas: auctions, merchant/dealer operations and trading.
Escala Group's North American operations include Greg Manning Auctions division, Ivy & Manning Philatelic Auctions, Greg Manning Galleries, Greg Martin Auctions, Spectrum Numismatics, Teletrade, Nutmeg Stamp Sales, Superior Sports Auctions, Bowers and Merena Auctions, and Kingswood Coin Auctions, and H.R. Harmer. In Europe, the leading auction houses affiliated with the network are Auctentia Subastas (Afinsa Auctions) of Madrid, Spain, Corinphila Auktionen of Zurich, Switzerland, and the Koehler group of auction companies of Berlin and Wiesbaden, Germany. In Asia, Escala's auctions operations are conducted through John Bull Stamp Auctions, Ltd, the oldest philatelic auction house in Hong Kong.
The trading activities of Escala Group are conducted through A-Mark Precious Metals, one of the largest private sellers of bullion coins and bullion gold, silver and platinum to the wholesale marketplace.
ABOUT ESCALA GROUP
Escala Group is a global federation of leading companies in the collectibles market with operations in North America, Europe and Asia as well as on the Internet. The company operates through a number of subsidiaries that specialize in various sectors of the collectibles markets, and is comprised of three business areas: auctions, merchant/dealer operations and trading.
Escala Group's North American operations include Greg Manning Auctions division, Ivy & Manning Philatelic Auctions, Greg Manning Galleries, Greg Martin Auctions, Spectrum Numismatics, Teletrade, Nutmeg Stamp Sales, Superior Sports Auctions, Bowers and Merena Auctions, and Kingswood Coin Auctions, and H.R. Harmer. In Europe, the leading auction houses affiliated with the network are Auctentia Subastas (Afinsa Auctions) of Madrid, Spain, Corinphila Auktionen of Zurich, Switzerland, and the Koehler group of auction companies of Berlin and Wiesbaden, Germany. In Asia, Escala's auctions operations are conducted through John Bull Stamp Auctions, Ltd, the oldest philatelic auction house in Hong Kong.
The trading activities of Escala Group are conducted through A-Mark Precious Metals, one of the largest private sellers of bullion coins and bullion gold, silver and platinum to the wholesale marketplace.
Tuesday, October 17, 2006
Angeion Corp. (ANGN)
Angeion looks to be a buy for us here at 'Stocks Online'
These charts look good to me ANGN charts, but what do I know!
Also, it has some really good chart on stock charts check it out here!
One good thing that I really enjoyed and stuck out was the earning went from a loss of $(1.86)/share in 2001 down to a loss of $(.25)/share in 2005. The Angeion (ANGN) has turned around a profit with $.41/share reported. The Angeion (ANGN) has kept its 4 million shares outstanding stable from 2001 to present reports.
One thing that is a must for a lot of fundamentals is the free cash flow! Which with ANGN has been negative at $(1) million in 2003-2005, turned positive with $2 million reported as of recently. So that's a pretty impressive turnout that is turning a lot of head including ours here at stocks online! Also, with a $2.5 million in cash and $11.9 million in other current assets.
Seems to be an interesting look or at least one to be checking out and keeping an eye on it. Espcially after Angeion (ANGN) shares soared 80% on Monday after the tiny medical diagnostic systems maker swung to a fiscal third-quarter profit.
These charts look good to me ANGN charts, but what do I know!
Also, it has some really good chart on stock charts check it out here!
One good thing that I really enjoyed and stuck out was the earning went from a loss of $(1.86)/share in 2001 down to a loss of $(.25)/share in 2005. The Angeion (ANGN) has turned around a profit with $.41/share reported. The Angeion (ANGN) has kept its 4 million shares outstanding stable from 2001 to present reports.
One thing that is a must for a lot of fundamentals is the free cash flow! Which with ANGN has been negative at $(1) million in 2003-2005, turned positive with $2 million reported as of recently. So that's a pretty impressive turnout that is turning a lot of head including ours here at stocks online! Also, with a $2.5 million in cash and $11.9 million in other current assets.
Seems to be an interesting look or at least one to be checking out and keeping an eye on it. Espcially after Angeion (ANGN) shares soared 80% on Monday after the tiny medical diagnostic systems maker swung to a fiscal third-quarter profit.
Wednesday, October 11, 2006
Technical vs. Fundamental Analysis
Technical vs. Fundamental Analysis
By Thomas Stone of statisticaltrading.com
The debate rages on. Which is better, technical analysis or fundamental analysis?
The question seems simple but it is deceptive. Underneath the question is an unspoken assumption about time horizons. Is the questioner an investor or a trader?
An investor is becoming part of something. The investor makes his choices based on a belief in the future. He desires to help make something successful. If he believes that apples will be in great demand next year he may invest in an orchard to grow apples for sale next year. During the year, while his apples are growing, he may ignore the day-to-day price changes of apples because his focus is on next year.
The trader doesn’t care to be part of anything other than the enterprise of making money. If he thinks orchards will increase in price next week, he’ll buy an orchard. He doesn’t care about orchards or apples. He’d buy a worm farm today if he thought he could turn a dime on it next week. He is very concerned about day-to-day price fluctuations since it is the past behavior of prices that make him expect the price to go up next week.
If the belief in the future value of apples is shaken then some of the orchard investors may decide that running an orchard isn’t the best choice. They abandon the business. Other investors see the cost of orchards dropping and, at some price point, believe that the now lower cost of orchards justifies the apple business given the reduced future price of apples. They start buying orchards.
This doesn’t happen all at once. Not everyone agrees with the amount that the price of apples will drop by. Because of this, different people see different price points as being good times to get back into the apple business.
The investor uses fundamental analysis to make his decisions, but what is the trader doing?
The trader is watching the patterns in the price of orchards and how frequently orchards are changing ownership as the prices go up or down. Eventually the pattern looks like a pattern that he has seen many times before and it usually occurs when prices have finished dropping and they are about to start escalating. Based on this, he decides to buy an orchard. He will hold that orchard until he thinks that he sees a pattern that suggests that the price of orchards will stop going up. He then sells the orchard. He has used technical analysis.
The trader’s technical analysis would be worthless without investors doing their fundamental analysis. Without the investors, there would be no patterns to watch for. It is the investors making their decisions based on fundamental analysis that creates the pricing patterns that the technical trader watches. The pricing pattern that indicates a bottoming in prices occurs when the price falls far enough to start attracting a large number of investors.
In the end, neither is better. Both technical and fundamental analysis help to create an efficient marketplace that can deliver goods to the consumer.
I refer to users of technical analysis as traders and users of fundamental analysis as investors. Their time horizons usually differ. Traders look to get in and out of a trade in hours, days, weeks, and sometimes months. Investors usually get in for months to years.
If you have a strong belief that something is going to happen and you are in the minority then you have an excellent opportunity to make a lot of money by investing in companies that stand to profit from that eventuality. Those profits won’t materialize until you are no longer in the minority. As more and more people start to share your belief, the prices of those companies will rise and you can profit handsomely. While you are waiting for others to start sharing your beliefs, the prices of those companies may go up and down. As long as your belief isn’t swayed you may bear those price swings secure in the knowledge of what is to come. You are an investor. On the other hand, if you’re wrong…
An example may be a belief that there will be water shortages resulting from global warming. Believing this, you may decide to invest part of your money in companies that build desalinization plants. You believe that, over the next 10-15 years, these companies’ products will see soaring demand. Secure in the belief that this will occur, you will not be terribly concerned if the price of one of those companies drops 5 percent next month. You believe that it will recover and then some. You are basing your decision on fundamental analysis.
The above is fundamental analysis on a macro economic scale. Bringing fundamental analysis to bear on a company-by-company basis is much more difficult. Numerous data points need to be entered, many of which are not available as hard data but rely on assumptions made by the person performing the fundamental analysis. One type of fundamental analysis called Discounted Cash Flow (DCF) is currently very popular. It involves formulas that take operating profit, depreciation, amortization, goodwill, capital expenditures, cash taxes, changes in working capital, and weighted average cost of capital, to arrive at a valuation for a company (see http://www.investopedia.com/articles/03/011403.asp for more detail).
Just collecting the data needed to perform the analysis for a single company can be a daunting task. Performing this kind of analysis on a large number of companies on a regular basis quickly becomes a full time job.
The trader on the other hand can use computers to scan for likely candidates for the pricing patterns that he uses. Within minutes a computer can download data on thousands of stocks and have the computer bring up relatively short lists of stocks that are potential candidates for trades.
A trader may also use technical analysis on the market as a whole to move money back and forth between an index fund and a money market fund. One simple way to do this is by using the market breadth.
Market breadth is simply a measure of the difference between the number of advancing issues and the number of declining issues on an exchange such as the NYSE. If 1200 stocks go up in price and 500 go down in price then the breadth is +700. We can calculate this number every day and then look for trends by calculating moving averages of these numbers. A good way to get long term directional movements is to analysis how two different moving averages changes relative to each other. The name for that practice is called Moving Average Convergence Divergence or MACD. If we apply MACD to the breadth using a 19-day and a 39-day moving average then we get a well-known indicator called the McClellan Summation Index (MSI).
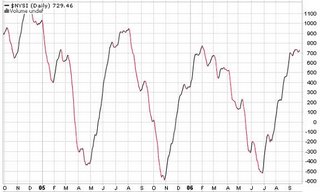
Figure 1: MSI courtesy of StockCharts.com
If we look at the SP-500 for the same time frame
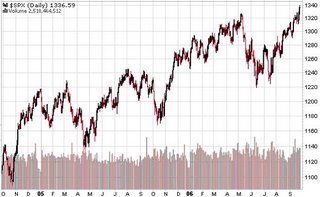
Figure 2: SP-500 courtesy of Stockcharts.com
If you had bought and sold an index fund based on the MSI peaks and valleys then you would have made the following trades (numbers and dates approximated)
Purchase date Cost Sales Date Price Profit/(Loss)
Late April ‘05 $1140 Late July ‘05 $1240 8.5%
Late Oct ‘05 $1180 Late Jan ‘06 $1280 8.5%
Late June ‘06 $1240 Late Sept ‘06 $1335 7.5%
You would have been in the market for 9 out of the last 17 months. While in the market you would have realized a 24.5% return plus the money market interest earned during the other 8 months, lets say 2.5%. That works out to a 19% annualized return (27*(12/17)).
How do you know when the MSI is at a peak or a valley? I use the MACD of the MSI with the averages being 30-day and 50-day. This smoothes out the action of the MSI and clearly shows the overall direction that it is moving in.
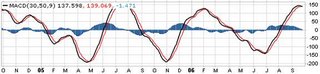
Figure 3: MACD of MSI courtesy of Stockcharts.com
The black line on the graph is a 9-day moving average of the red line. The red line is the MACD. The histogram shows the difference between the red and black line. The buy signal is when the MSI falls below –300 and the black line crosses up over the red line as it did in late Apr ’05, early Nov ’05, and late June ’06. The sell signal is when the MSI rises above +500 and the black line falls under the red line as it did in late July ’05, early Feb ’06, and late Sept ’06.
This indicator is not perfect at picking tops and bottoms. It is good at warning when the breadth of the market is no longer supportive of the direction of the market. The market usually changes direction shortly after that occurs. In the spring of ’06, this indicator was falling while the market indexes were advancing for an unusually long time. This meant that the number of stocks participating in the market move was dropping off. Fewer and fewer stocks were trading above their 40-day moving averages each week even as the SP-500 moved upward.
There are numerous technical indicators in use and there are many good books that discuss these indicators in depth. One such book is “New Trading Systems and Methods” by Perry J Kaufman. There are also computer programs that can be purchased that have many of these indictors built in such as TC2005 from Worden Bros (www.worden.com). There are also websites that have many of these indicators built in and some on-line brokers have charting packages containing some of the indicators.
The extreme in technical analysis is called Mechanical Trading. In mechanical trading a computer has extensively tested a set of indicators over numerous sets of historical data to arrive at an “ideal” set of indicators which the computer uses to issue buy and sell recommendations completely without any human intervention. My website, www.statisticaltrading.com, allows people to subscribe to computer generated buy and sell recommendations. Our computers have honed sets of technical indicators that have over 83% success rates with average holding times of 5-6 weeks. All recommendations come in the evening for execution at the next morning’s open; there is no day trading support on the site. We also offer a market timing service and a dividend investing service.
By Thomas Stone of statisticaltrading.com
The debate rages on. Which is better, technical analysis or fundamental analysis?
The question seems simple but it is deceptive. Underneath the question is an unspoken assumption about time horizons. Is the questioner an investor or a trader?
An investor is becoming part of something. The investor makes his choices based on a belief in the future. He desires to help make something successful. If he believes that apples will be in great demand next year he may invest in an orchard to grow apples for sale next year. During the year, while his apples are growing, he may ignore the day-to-day price changes of apples because his focus is on next year.
The trader doesn’t care to be part of anything other than the enterprise of making money. If he thinks orchards will increase in price next week, he’ll buy an orchard. He doesn’t care about orchards or apples. He’d buy a worm farm today if he thought he could turn a dime on it next week. He is very concerned about day-to-day price fluctuations since it is the past behavior of prices that make him expect the price to go up next week.
If the belief in the future value of apples is shaken then some of the orchard investors may decide that running an orchard isn’t the best choice. They abandon the business. Other investors see the cost of orchards dropping and, at some price point, believe that the now lower cost of orchards justifies the apple business given the reduced future price of apples. They start buying orchards.
This doesn’t happen all at once. Not everyone agrees with the amount that the price of apples will drop by. Because of this, different people see different price points as being good times to get back into the apple business.
The investor uses fundamental analysis to make his decisions, but what is the trader doing?
The trader is watching the patterns in the price of orchards and how frequently orchards are changing ownership as the prices go up or down. Eventually the pattern looks like a pattern that he has seen many times before and it usually occurs when prices have finished dropping and they are about to start escalating. Based on this, he decides to buy an orchard. He will hold that orchard until he thinks that he sees a pattern that suggests that the price of orchards will stop going up. He then sells the orchard. He has used technical analysis.
The trader’s technical analysis would be worthless without investors doing their fundamental analysis. Without the investors, there would be no patterns to watch for. It is the investors making their decisions based on fundamental analysis that creates the pricing patterns that the technical trader watches. The pricing pattern that indicates a bottoming in prices occurs when the price falls far enough to start attracting a large number of investors.
In the end, neither is better. Both technical and fundamental analysis help to create an efficient marketplace that can deliver goods to the consumer.
I refer to users of technical analysis as traders and users of fundamental analysis as investors. Their time horizons usually differ. Traders look to get in and out of a trade in hours, days, weeks, and sometimes months. Investors usually get in for months to years.
If you have a strong belief that something is going to happen and you are in the minority then you have an excellent opportunity to make a lot of money by investing in companies that stand to profit from that eventuality. Those profits won’t materialize until you are no longer in the minority. As more and more people start to share your belief, the prices of those companies will rise and you can profit handsomely. While you are waiting for others to start sharing your beliefs, the prices of those companies may go up and down. As long as your belief isn’t swayed you may bear those price swings secure in the knowledge of what is to come. You are an investor. On the other hand, if you’re wrong…
An example may be a belief that there will be water shortages resulting from global warming. Believing this, you may decide to invest part of your money in companies that build desalinization plants. You believe that, over the next 10-15 years, these companies’ products will see soaring demand. Secure in the belief that this will occur, you will not be terribly concerned if the price of one of those companies drops 5 percent next month. You believe that it will recover and then some. You are basing your decision on fundamental analysis.
The above is fundamental analysis on a macro economic scale. Bringing fundamental analysis to bear on a company-by-company basis is much more difficult. Numerous data points need to be entered, many of which are not available as hard data but rely on assumptions made by the person performing the fundamental analysis. One type of fundamental analysis called Discounted Cash Flow (DCF) is currently very popular. It involves formulas that take operating profit, depreciation, amortization, goodwill, capital expenditures, cash taxes, changes in working capital, and weighted average cost of capital, to arrive at a valuation for a company (see http://www.investopedia.com/articles/03/011403.asp for more detail).
Just collecting the data needed to perform the analysis for a single company can be a daunting task. Performing this kind of analysis on a large number of companies on a regular basis quickly becomes a full time job.
The trader on the other hand can use computers to scan for likely candidates for the pricing patterns that he uses. Within minutes a computer can download data on thousands of stocks and have the computer bring up relatively short lists of stocks that are potential candidates for trades.
A trader may also use technical analysis on the market as a whole to move money back and forth between an index fund and a money market fund. One simple way to do this is by using the market breadth.
Market breadth is simply a measure of the difference between the number of advancing issues and the number of declining issues on an exchange such as the NYSE. If 1200 stocks go up in price and 500 go down in price then the breadth is +700. We can calculate this number every day and then look for trends by calculating moving averages of these numbers. A good way to get long term directional movements is to analysis how two different moving averages changes relative to each other. The name for that practice is called Moving Average Convergence Divergence or MACD. If we apply MACD to the breadth using a 19-day and a 39-day moving average then we get a well-known indicator called the McClellan Summation Index (MSI).

Figure 1: MSI courtesy of StockCharts.com
If we look at the SP-500 for the same time frame
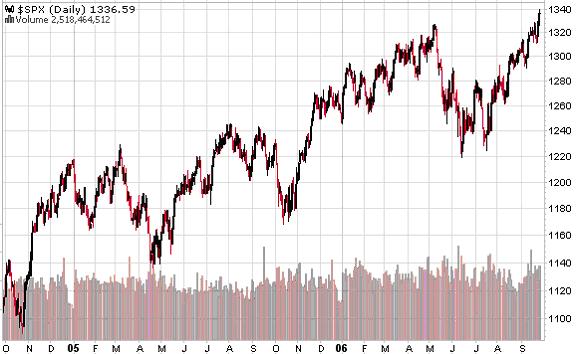
Figure 2: SP-500 courtesy of Stockcharts.com
If you had bought and sold an index fund based on the MSI peaks and valleys then you would have made the following trades (numbers and dates approximated)
Purchase date Cost Sales Date Price Profit/(Loss)
Late April ‘05 $1140 Late July ‘05 $1240 8.5%
Late Oct ‘05 $1180 Late Jan ‘06 $1280 8.5%
Late June ‘06 $1240 Late Sept ‘06 $1335 7.5%
You would have been in the market for 9 out of the last 17 months. While in the market you would have realized a 24.5% return plus the money market interest earned during the other 8 months, lets say 2.5%. That works out to a 19% annualized return (27*(12/17)).
How do you know when the MSI is at a peak or a valley? I use the MACD of the MSI with the averages being 30-day and 50-day. This smoothes out the action of the MSI and clearly shows the overall direction that it is moving in.
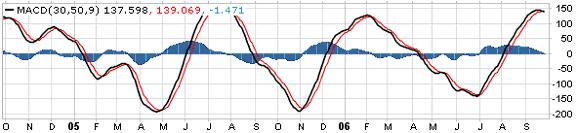
Figure 3: MACD of MSI courtesy of Stockcharts.com
The black line on the graph is a 9-day moving average of the red line. The red line is the MACD. The histogram shows the difference between the red and black line. The buy signal is when the MSI falls below –300 and the black line crosses up over the red line as it did in late Apr ’05, early Nov ’05, and late June ’06. The sell signal is when the MSI rises above +500 and the black line falls under the red line as it did in late July ’05, early Feb ’06, and late Sept ’06.
This indicator is not perfect at picking tops and bottoms. It is good at warning when the breadth of the market is no longer supportive of the direction of the market. The market usually changes direction shortly after that occurs. In the spring of ’06, this indicator was falling while the market indexes were advancing for an unusually long time. This meant that the number of stocks participating in the market move was dropping off. Fewer and fewer stocks were trading above their 40-day moving averages each week even as the SP-500 moved upward.
There are numerous technical indicators in use and there are many good books that discuss these indicators in depth. One such book is “New Trading Systems and Methods” by Perry J Kaufman. There are also computer programs that can be purchased that have many of these indictors built in such as TC2005 from Worden Bros (www.worden.com). There are also websites that have many of these indicators built in and some on-line brokers have charting packages containing some of the indicators.
The extreme in technical analysis is called Mechanical Trading. In mechanical trading a computer has extensively tested a set of indicators over numerous sets of historical data to arrive at an “ideal” set of indicators which the computer uses to issue buy and sell recommendations completely without any human intervention. My website, www.statisticaltrading.com, allows people to subscribe to computer generated buy and sell recommendations. Our computers have honed sets of technical indicators that have over 83% success rates with average holding times of 5-6 weeks. All recommendations come in the evening for execution at the next morning’s open; there is no day trading support on the site. We also offer a market timing service and a dividend investing service.
Monday, October 09, 2006
Getting Started: Learning the Market and Selecting Stocks
Getting Started: Learning the Market and Selecting Stocks
If you were going to spend several thousand dollars on a refrigerator or television, you would thoroughly research the market for those goods to find the product which best suited your needs. Investing is no different. Before buying into a company, you should be well-acquainted enough with it to give a short presentation. Knowing the basics of how a company operates, what it sells, how it makes money, how much money it makes, and what kind of growth the company is expected to experience are all crucial questions that any investor should be able to answer. Developing a better understanding of the stock market is a long, but hopefully rewarding, process. Immediately investing in stocks with real money, however, is equivalent to taking a test without being introduced to the material. Formerly called “paper trading”, beginning investors would normally spend several months tracking their stock picks without having real money on them. Thanks to technology, you can now find sites that automate (for free) the process of tracking price changes for you on the internet. Simulated investing is a risk-free way of beginning to understand market fluctuations and the forces driving them. Examining these trends will payoff in the future, as an increased understanding of the stock market can only help you on your path to building wealth. Once you become comfortable picking your own stocks, you can still continue to “paper trade” online, as it offers the opportunity to explore and experiment with other investing styles. Gordon Gekko, the famed villain in Wall Street played by Michael Douglas, said “Information is the most valuable commodity I know of”. Ignoring for a moment that the movie ended with indictments for insider trading, the statement is true: you will not regret being an informed and intelligent investor. The market is constantly changing, but by learning the ropes of investing you too can pull off a “One Up on Wall Street”.
Especialy thanks from einvesting.com Don't start investing alone. Check out einvesting.com today!
If you were going to spend several thousand dollars on a refrigerator or television, you would thoroughly research the market for those goods to find the product which best suited your needs. Investing is no different. Before buying into a company, you should be well-acquainted enough with it to give a short presentation. Knowing the basics of how a company operates, what it sells, how it makes money, how much money it makes, and what kind of growth the company is expected to experience are all crucial questions that any investor should be able to answer. Developing a better understanding of the stock market is a long, but hopefully rewarding, process. Immediately investing in stocks with real money, however, is equivalent to taking a test without being introduced to the material. Formerly called “paper trading”, beginning investors would normally spend several months tracking their stock picks without having real money on them. Thanks to technology, you can now find sites that automate (for free) the process of tracking price changes for you on the internet. Simulated investing is a risk-free way of beginning to understand market fluctuations and the forces driving them. Examining these trends will payoff in the future, as an increased understanding of the stock market can only help you on your path to building wealth. Once you become comfortable picking your own stocks, you can still continue to “paper trade” online, as it offers the opportunity to explore and experiment with other investing styles. Gordon Gekko, the famed villain in Wall Street played by Michael Douglas, said “Information is the most valuable commodity I know of”. Ignoring for a moment that the movie ended with indictments for insider trading, the statement is true: you will not regret being an informed and intelligent investor. The market is constantly changing, but by learning the ropes of investing you too can pull off a “One Up on Wall Street”.
Especialy thanks from einvesting.com Don't start investing alone. Check out einvesting.com today!
Thursday, October 05, 2006
GARP
GARP
GARP, or Growth At Reasonable Price. As the name implies, the focus is finding growing companies trading at reasonable prices. Quick measures of this include the PEG ratio (Price to Earnings to Growth) and Forward P/E. Although not a specific style, GARP is utilized by many investors because of its flexibility. The average, diversified portfolio will have many GARP-type stocks in it.
GARP, or Growth At Reasonable Price. As the name implies, the focus is finding growing companies trading at reasonable prices. Quick measures of this include the PEG ratio (Price to Earnings to Growth) and Forward P/E. Although not a specific style, GARP is utilized by many investors because of its flexibility. The average, diversified portfolio will have many GARP-type stocks in it.
Wednesday, October 04, 2006
What is my risk tolerance and investing style
What is my risk tolerance? What is my investing style?
This question leads us to selecting individual investments. Consider your investment timetable for when you’ll need the money, recognizing that more conservative selections should be made the shorter the window. Everyone’s risk tolerance is different; while one person may feel comfortable with small-cap biotechs another may need a blue chip to feel equally sound.
Analyzing the risk to reward ratio here is a good first step. The more risk you take on, the more you should expect to get in return if your investment pays off. The inverse is also true: the more stable an investment, the less return one should expect. Government-backed I Bonds pay over 6%, but involve tying up money for years in order to fully benefit from them. While this gives you one target, the average return of the broader market indices is about 11% per year. There are two primary schools of thought about investing: growth and value.
Growth
Growth investing is a higher-risk strategy which focuses on finding smaller companies poised to rapidly grow earnings. Stocks here tend to be micro-caps or small-caps, and the occasional mid-cap (under $10 billion). In their younger lives, many of the well-established companies of today found themselves considered here (Think of Apple Computers (AAPL) or Starbucks (SBUX)). Growth companies can be found in many different sectors, although such companies often have similar traits. A growth company usually has a unique product or service to offer which can fundamentally change how business is done. When found early enough in their growth cycles, these companies have the potential to return enormous profits to investors.
Value
Value plays usually are found in larger companies, although the strategies used to find them can be applied to smaller corporations as well. Looking for value stocks is similar to looking for values in a store: find a good product at a price below what you would normally expect to pay. These bargains are often found in the form of companies which have been unfairly beaten down through overselling. Finding value stocks usually involves using a discounted cash flow model (DCF) to find a company’s intrinsic value. This is the form of investing advocated by Benjamin Graham, and popularized by Warren Buffett.
This question leads us to selecting individual investments. Consider your investment timetable for when you’ll need the money, recognizing that more conservative selections should be made the shorter the window. Everyone’s risk tolerance is different; while one person may feel comfortable with small-cap biotechs another may need a blue chip to feel equally sound.
Analyzing the risk to reward ratio here is a good first step. The more risk you take on, the more you should expect to get in return if your investment pays off. The inverse is also true: the more stable an investment, the less return one should expect. Government-backed I Bonds pay over 6%, but involve tying up money for years in order to fully benefit from them. While this gives you one target, the average return of the broader market indices is about 11% per year. There are two primary schools of thought about investing: growth and value.
Growth
Growth investing is a higher-risk strategy which focuses on finding smaller companies poised to rapidly grow earnings. Stocks here tend to be micro-caps or small-caps, and the occasional mid-cap (under $10 billion). In their younger lives, many of the well-established companies of today found themselves considered here (Think of Apple Computers (AAPL) or Starbucks (SBUX)). Growth companies can be found in many different sectors, although such companies often have similar traits. A growth company usually has a unique product or service to offer which can fundamentally change how business is done. When found early enough in their growth cycles, these companies have the potential to return enormous profits to investors.
Value
Value plays usually are found in larger companies, although the strategies used to find them can be applied to smaller corporations as well. Looking for value stocks is similar to looking for values in a store: find a good product at a price below what you would normally expect to pay. These bargains are often found in the form of companies which have been unfairly beaten down through overselling. Finding value stocks usually involves using a discounted cash flow model (DCF) to find a company’s intrinsic value. This is the form of investing advocated by Benjamin Graham, and popularized by Warren Buffett.
Questions to ask before investing
Questions to ask before investing
How much do I initially have to invest? How much can I afford to consistently add later?
Einstein described compounding as “The Eighth Wonder of the World” and for good reason. Being able to earn interest on your interest allows investments to increase exponentially faster than with simple interest. A one-time investment of $5000 earning 10% interest compounds to a total of over $54,000 after 25 years. Using simple interest, it would take over 95 years to reach the same amount. Naturally, the larger your initial investment and the more you can afford to add later on, the more you can expect to gain in returns.
Am I carrying any high-interest debt, such as on a credit card?
Before saving for future events, you should consider your present finances. Paying off any high-interest loans function as an “automatic” return. Writing a check to Visa to pay down your debt may not feel as satisfying as starting a nest egg, but by eliminating those 22% interest payments, you have effectively “made” a 22% return. Although you need not completely eliminate your debts, getting such payments into a reasonable area should be a more pressing priority.
This fiscal reckoning is also a good time to examine budgeting and expenditures. Look for unneeded or overpriced purchases, and consider the feasibility of paring them down and saving the extra money. Unused gym memberships, that $5 whipped mocha-hazelnut cappuccino, and extra cable channels all add up. The true cost of these and all other purchases involves understanding the “time value of money”, but for now it should suffice to say that $5 added to the previously mentioned investment account compounding 10% for 25 years turns into $54.17.
How much do I initially have to invest? How much can I afford to consistently add later?
Einstein described compounding as “The Eighth Wonder of the World” and for good reason. Being able to earn interest on your interest allows investments to increase exponentially faster than with simple interest. A one-time investment of $5000 earning 10% interest compounds to a total of over $54,000 after 25 years. Using simple interest, it would take over 95 years to reach the same amount. Naturally, the larger your initial investment and the more you can afford to add later on, the more you can expect to gain in returns.
Am I carrying any high-interest debt, such as on a credit card?
Before saving for future events, you should consider your present finances. Paying off any high-interest loans function as an “automatic” return. Writing a check to Visa to pay down your debt may not feel as satisfying as starting a nest egg, but by eliminating those 22% interest payments, you have effectively “made” a 22% return. Although you need not completely eliminate your debts, getting such payments into a reasonable area should be a more pressing priority.
This fiscal reckoning is also a good time to examine budgeting and expenditures. Look for unneeded or overpriced purchases, and consider the feasibility of paring them down and saving the extra money. Unused gym memberships, that $5 whipped mocha-hazelnut cappuccino, and extra cable channels all add up. The true cost of these and all other purchases involves understanding the “time value of money”, but for now it should suffice to say that $5 added to the previously mentioned investment account compounding 10% for 25 years turns into $54.17.
Technical vs. Fundamental Analysis
Technical vs. Fundamental Analysis
By Thomas Stone of statisticaltrading.com
The debate rages on. Which is better, technical analysis or fundamental analysis?
The question seems simple but it is deceptive. Underneath the question is an unspoken assumption about time horizons. Is the questioner an investor or a trader?
An investor is becoming part of something. The investor makes his choices based on a belief in the future. He desires to help make something successful. If he believes that apples will be in great demand next year he may invest in an orchard to grow apples for sale next year. During the year, while his apples are growing, he may ignore the day-to-day price changes of apples because his focus is on next year.
The trader doesn’t care to be part of anything other than the enterprise of making money. If he thinks orchards will increase in price next week, he’ll buy an orchard. He doesn’t care about orchards or apples. He’d buy a worm farm today if he thought he could turn a dime on it next week. He is very concerned about day-to-day price fluctuations since it is the past behavior of prices that make him expect the price to go up next week.
If the belief in the future value of apples is shaken then some of the orchard investors may decide that running an orchard isn’t the best choice. They abandon the business. Other investors see the cost of orchards dropping and, at some price point, believe that the now lower cost of orchards justifies the apple business given the reduced future price of apples. They start buying orchards.
This doesn’t happen all at once. Not everyone agrees with the amount that the price of apples will drop by. Because of this, different people see different price points as being good times to get back into the apple business.
The investor uses fundamental analysis to make his decisions, but what is the trader doing?
The trader is watching the patterns in the price of orchards and how frequently orchards are changing ownership as the prices go up or down. Eventually the pattern looks like a pattern that he has seen many times before and it usually occurs when prices have finished dropping and they are about to start escalating. Based on this, he decides to buy an orchard. He will hold that orchard until he thinks that he sees a pattern that suggests that the price of orchards will stop going up. He then sells the orchard. He has used technical analysis.
The trader’s technical analysis would be worthless without investors doing their fundamental analysis. Without the investors, there would be no patterns to watch for. It is the investors making their decisions based on fundamental analysis that creates the pricing patterns that the technical trader watches. The pricing pattern that indicates a bottoming in prices occurs when the price falls far enough to start attracting a large number of investors.
In the end, neither is better. Both technical and fundamental analysis help to create an efficient marketplace that can deliver goods to the consumer.
I refer to users of technical analysis as traders and users of fundamental analysis as investors. Their time horizons usually differ. Traders look to get in and out of a trade in hours, days, weeks, and sometimes months. Investors usually get in for months to years.
If you have a strong belief that something is going to happen and you are in the minority then you have an excellent opportunity to make a lot of money by investing in companies that stand to profit from that eventuality. Those profits won’t materialize until you are no longer in the minority. As more and more people start to share your belief, the prices of those companies will rise and you can profit handsomely. While you are waiting for others to start sharing your beliefs, the prices of those companies may go up and down. As long as your belief isn’t swayed you may bear those price swings secure in the knowledge of what is to come. You are an investor. On the other hand, if you’re wrong…
An example may be a belief that there will be water shortages resulting from global warming. Believing this, you may decide to invest part of your money in companies that build desalinization plants. You believe that, over the next 10-15 years, these companies’ products will see soaring demand. Secure in the belief that this will occur, you will not be terribly concerned if the price of one of those companies drops 5 percent next month. You believe that it will recover and then some. You are basing your decision on fundamental analysis.
The above is fundamental analysis on a macro economic scale. Bringing fundamental analysis to bear on a company-by-company basis is much more difficult. Numerous data points need to be entered, many of which are not available as hard data but rely on assumptions made by the person performing the fundamental analysis. One type of fundamental analysis called Discounted Cash Flow (DCF) is currently very popular. It involves formulas that take operating profit, depreciation, amortization, goodwill, capital expenditures, cash taxes, changes in working capital, and weighted average cost of capital, to arrive at a valuation for a company (see http://www.investopedia.com/articles/03/011403.asp for more detail).
Just collecting the data needed to perform the analysis for a single company can be a daunting task. Performing this kind of analysis on a large number of companies on a regular basis quickly becomes a full time job.
The trader on the other hand can use computers to scan for likely candidates for the pricing patterns that he uses. Within minutes a computer can download data on thousands of stocks and have the computer bring up relatively short lists of stocks that are potential candidates for trades.
A trader may also use technical analysis on the market as a whole to move money back and forth between an index fund and a money market fund. One simple way to do this is by using the market breadth.
Market breadth is simply a measure of the difference between the number of advancing issues and the number of declining issues on an exchange such as the NYSE. If 1200 stocks go up in price and 500 go down in price then the breadth is +700. We can calculate this number every day and then look for trends by calculating moving averages of these numbers. A good way to get long term directional movements is to analysis how two different moving averages changes relative to each other. The name for that practice is called Moving Average Convergence Divergence or MACD. If we apply MACD to the breadth using a 19-day and a 39-day moving average then we get a well-known indicator called the McClellan Summation Index (MSI).
Figure 1: MSI courtesy of StockCharts.com
If we look at the SP-500 for the same time frame
Figure 2: SP-500 courtesy of Stockcharts.com
If you had bought and sold an index fund based on the MSI peaks and valleys then you would have made the following trades (numbers and dates approximated)
Purchase date Cost Sales Date Price Profit/(Loss)
Late April ‘05 $1140 Late July ‘05 $1240 8.5%
Late Oct ‘05 $1180 Late Jan ‘06 $1280 8.5%
Late June ‘06 $1240 Late Sept ‘06 $1335 7.5%
You would have been in the market for 9 out of the last 17 months. While in the market you would have realized a 24.5% return plus the money market interest earned during the other 8 months, lets say 2.5%. That works out to a 19% annualized return (27*(12/17)).
How do you know when the MSI is at a peak or a valley? I use the MACD of the MSI with the averages being 30-day and 50-day. This smoothes out the action of the MSI and clearly shows the overall direction that it is moving in.
Figure 3: MACD of MSI courtesy of Stockcharts.com
The black line on the graph is a 9-day moving average of the red line. The red line is the MACD. The histogram shows the difference between the red and black line. The buy signal is when the MSI falls below –300 and the black line crosses up over the red line as it did in late Apr ’05, early Nov ’05, and late June ’06. The sell signal is when the MSI rises above +500 and the black line falls under the red line as it did in late July ’05, early Feb ’06, and late Sept ’06.
This indicator is not perfect at picking tops and bottoms. It is good at warning when the breadth of the market is no longer supportive of the direction of the market. The market usually changes direction shortly after that occurs. In the spring of ’06, this indicator was falling while the market indexes were advancing for an unusually long time. This meant that the number of stocks participating in the market move was dropping off. Fewer and fewer stocks were trading above their 40-day moving averages each week even as the SP-500 moved upward.
There are numerous technical indicators in use and there are many good books that discuss these indicators in depth. One such book is “New Trading Systems and Methods” by Perry J Kaufman. There are also computer programs that can be purchased that have many of these indictors built in such as TC2005 from Worden Bros (www.worden.com). There are also websites that have many of these indicators built in and some on-line brokers have charting packages containing some of the indicators.
The extreme in technical analysis is called Mechanical Trading. In mechanical trading a computer has extensively tested a set of indicators over numerous sets of historical data to arrive at an “ideal” set of indicators which the computer uses to issue buy and sell recommendations completely without any human intervention. My website, www.statisticaltrading.com, allows people to subscribe to computer generated buy and sell recommendations. Our computers have honed sets of technical indicators that have over 83% success rates with average holding times of 5-6 weeks. All recommendations come in the evening for execution at the next morning’s open; there is no day trading support on the site. We also offer a market timing service and a dividend investing service.
By Thomas Stone of statisticaltrading.com
The debate rages on. Which is better, technical analysis or fundamental analysis?
The question seems simple but it is deceptive. Underneath the question is an unspoken assumption about time horizons. Is the questioner an investor or a trader?
An investor is becoming part of something. The investor makes his choices based on a belief in the future. He desires to help make something successful. If he believes that apples will be in great demand next year he may invest in an orchard to grow apples for sale next year. During the year, while his apples are growing, he may ignore the day-to-day price changes of apples because his focus is on next year.
The trader doesn’t care to be part of anything other than the enterprise of making money. If he thinks orchards will increase in price next week, he’ll buy an orchard. He doesn’t care about orchards or apples. He’d buy a worm farm today if he thought he could turn a dime on it next week. He is very concerned about day-to-day price fluctuations since it is the past behavior of prices that make him expect the price to go up next week.
If the belief in the future value of apples is shaken then some of the orchard investors may decide that running an orchard isn’t the best choice. They abandon the business. Other investors see the cost of orchards dropping and, at some price point, believe that the now lower cost of orchards justifies the apple business given the reduced future price of apples. They start buying orchards.
This doesn’t happen all at once. Not everyone agrees with the amount that the price of apples will drop by. Because of this, different people see different price points as being good times to get back into the apple business.
The investor uses fundamental analysis to make his decisions, but what is the trader doing?
The trader is watching the patterns in the price of orchards and how frequently orchards are changing ownership as the prices go up or down. Eventually the pattern looks like a pattern that he has seen many times before and it usually occurs when prices have finished dropping and they are about to start escalating. Based on this, he decides to buy an orchard. He will hold that orchard until he thinks that he sees a pattern that suggests that the price of orchards will stop going up. He then sells the orchard. He has used technical analysis.
The trader’s technical analysis would be worthless without investors doing their fundamental analysis. Without the investors, there would be no patterns to watch for. It is the investors making their decisions based on fundamental analysis that creates the pricing patterns that the technical trader watches. The pricing pattern that indicates a bottoming in prices occurs when the price falls far enough to start attracting a large number of investors.
In the end, neither is better. Both technical and fundamental analysis help to create an efficient marketplace that can deliver goods to the consumer.
I refer to users of technical analysis as traders and users of fundamental analysis as investors. Their time horizons usually differ. Traders look to get in and out of a trade in hours, days, weeks, and sometimes months. Investors usually get in for months to years.
If you have a strong belief that something is going to happen and you are in the minority then you have an excellent opportunity to make a lot of money by investing in companies that stand to profit from that eventuality. Those profits won’t materialize until you are no longer in the minority. As more and more people start to share your belief, the prices of those companies will rise and you can profit handsomely. While you are waiting for others to start sharing your beliefs, the prices of those companies may go up and down. As long as your belief isn’t swayed you may bear those price swings secure in the knowledge of what is to come. You are an investor. On the other hand, if you’re wrong…
An example may be a belief that there will be water shortages resulting from global warming. Believing this, you may decide to invest part of your money in companies that build desalinization plants. You believe that, over the next 10-15 years, these companies’ products will see soaring demand. Secure in the belief that this will occur, you will not be terribly concerned if the price of one of those companies drops 5 percent next month. You believe that it will recover and then some. You are basing your decision on fundamental analysis.
The above is fundamental analysis on a macro economic scale. Bringing fundamental analysis to bear on a company-by-company basis is much more difficult. Numerous data points need to be entered, many of which are not available as hard data but rely on assumptions made by the person performing the fundamental analysis. One type of fundamental analysis called Discounted Cash Flow (DCF) is currently very popular. It involves formulas that take operating profit, depreciation, amortization, goodwill, capital expenditures, cash taxes, changes in working capital, and weighted average cost of capital, to arrive at a valuation for a company (see http://www.investopedia.com/articles/03/011403.asp for more detail).
Just collecting the data needed to perform the analysis for a single company can be a daunting task. Performing this kind of analysis on a large number of companies on a regular basis quickly becomes a full time job.
The trader on the other hand can use computers to scan for likely candidates for the pricing patterns that he uses. Within minutes a computer can download data on thousands of stocks and have the computer bring up relatively short lists of stocks that are potential candidates for trades.
A trader may also use technical analysis on the market as a whole to move money back and forth between an index fund and a money market fund. One simple way to do this is by using the market breadth.
Market breadth is simply a measure of the difference between the number of advancing issues and the number of declining issues on an exchange such as the NYSE. If 1200 stocks go up in price and 500 go down in price then the breadth is +700. We can calculate this number every day and then look for trends by calculating moving averages of these numbers. A good way to get long term directional movements is to analysis how two different moving averages changes relative to each other. The name for that practice is called Moving Average Convergence Divergence or MACD. If we apply MACD to the breadth using a 19-day and a 39-day moving average then we get a well-known indicator called the McClellan Summation Index (MSI).
Figure 1: MSI courtesy of StockCharts.com
If we look at the SP-500 for the same time frame
Figure 2: SP-500 courtesy of Stockcharts.com
If you had bought and sold an index fund based on the MSI peaks and valleys then you would have made the following trades (numbers and dates approximated)
Purchase date Cost Sales Date Price Profit/(Loss)
Late April ‘05 $1140 Late July ‘05 $1240 8.5%
Late Oct ‘05 $1180 Late Jan ‘06 $1280 8.5%
Late June ‘06 $1240 Late Sept ‘06 $1335 7.5%
You would have been in the market for 9 out of the last 17 months. While in the market you would have realized a 24.5% return plus the money market interest earned during the other 8 months, lets say 2.5%. That works out to a 19% annualized return (27*(12/17)).
How do you know when the MSI is at a peak or a valley? I use the MACD of the MSI with the averages being 30-day and 50-day. This smoothes out the action of the MSI and clearly shows the overall direction that it is moving in.
Figure 3: MACD of MSI courtesy of Stockcharts.com
The black line on the graph is a 9-day moving average of the red line. The red line is the MACD. The histogram shows the difference between the red and black line. The buy signal is when the MSI falls below –300 and the black line crosses up over the red line as it did in late Apr ’05, early Nov ’05, and late June ’06. The sell signal is when the MSI rises above +500 and the black line falls under the red line as it did in late July ’05, early Feb ’06, and late Sept ’06.
This indicator is not perfect at picking tops and bottoms. It is good at warning when the breadth of the market is no longer supportive of the direction of the market. The market usually changes direction shortly after that occurs. In the spring of ’06, this indicator was falling while the market indexes were advancing for an unusually long time. This meant that the number of stocks participating in the market move was dropping off. Fewer and fewer stocks were trading above their 40-day moving averages each week even as the SP-500 moved upward.
There are numerous technical indicators in use and there are many good books that discuss these indicators in depth. One such book is “New Trading Systems and Methods” by Perry J Kaufman. There are also computer programs that can be purchased that have many of these indictors built in such as TC2005 from Worden Bros (www.worden.com). There are also websites that have many of these indicators built in and some on-line brokers have charting packages containing some of the indicators.
The extreme in technical analysis is called Mechanical Trading. In mechanical trading a computer has extensively tested a set of indicators over numerous sets of historical data to arrive at an “ideal” set of indicators which the computer uses to issue buy and sell recommendations completely without any human intervention. My website, www.statisticaltrading.com, allows people to subscribe to computer generated buy and sell recommendations. Our computers have honed sets of technical indicators that have over 83% success rates with average holding times of 5-6 weeks. All recommendations come in the evening for execution at the next morning’s open; there is no day trading support on the site. We also offer a market timing service and a dividend investing service.
Monday, October 02, 2006
Before entering the world of investing
Before entering the world of investing, it is important to honestly analyze your present situation. Doing so will allow you to effectively manage your own money in a way which maximizes returns while limiting unwanted risk. Questions to consider include:
What is my investment goal? How much time do I have to attain this goal?
Methods of saving for a down payment on a house differ greatly from saving for retirement. The reason for this lies in the factoring of time. Over short periods of
a few years, individual companies and the stock market as a whole can experience dramatic fluctuations which in no way represent longer-term trends. Because of this possibility, a smaller percentage of your portfolio should be allocated into stocks as the time for cashing in your investments draws near. Conversely, the longer the time period you have to invest, the more aggressive your portfolio should seek higher returns.
What is my investment goal? How much time do I have to attain this goal?
Methods of saving for a down payment on a house differ greatly from saving for retirement. The reason for this lies in the factoring of time. Over short periods of
a few years, individual companies and the stock market as a whole can experience dramatic fluctuations which in no way represent longer-term trends. Because of this possibility, a smaller percentage of your portfolio should be allocated into stocks as the time for cashing in your investments draws near. Conversely, the longer the time period you have to invest, the more aggressive your portfolio should seek higher returns.
Friday, September 29, 2006
Jim Cramer Quotes, Mad Money quotes, business quotes
Jim Cramer Quotes, Mad Money quotes, business quotes
The speculative public is indulged in stocks that I have no confidence in. There's a stock that I am sure of right now, Iomega, that is the third-tier player in a very cyclical market, storage for personal computers.
The third-tier players, Iomega, IMP, historically in this era when PC sales are threatened if there's a lot of competition in storage, the third-tier players usually cease to exist in six to eight months.
The way the credit cards were made in the '80s to be a people's form of capitalism and be able to make it so that you could get a loan that you would have been denied previous, now that's the way stocks are.
Their managements are not as shrewd and Hewlett-Packard. They're not as good as a management of Intel. They haven't seen downturns like the management of Merck.
There are companies out there in our country who historically have not been able to beat the Germans and the Japanese, who now beat them routinely.
There are tons of people who are late to trends by nature and adopt a trend after it's no longer in fashion. They exist in mutual funds. They exist in clothes. They exist in cars. They exist in lifestyles.
There were speculators saying that the foreign stocks had the stock going down. They were all wrong. Those classes of assets were dangerous at the time and they became great bargains.
There's accountability in the mutual fund industry. And they've been tremendous engines of wealth for people and they're going to continue to be so.
There've been fortunes made in Merck. There have been fortunes made in Pfizer. There will be fortunes again made in Merck and Pfizer.
These will be fabulous investments and will make millions of more people rich.
They had too many country clubs, too many airplanes, whatever. And raiders came in and rationalized those and then the raiders got too greedy and the raiders blew off. Good riddance.
This issue has died down right now because the way the corporate killers were on the cover of Newsweek and everybody's been hushed about the lay-offs.
Those were the people who sold were people who had chased previously good performance in '93. Now we have seen those funds suffer massive redemptions, at times being down as much as 40-50 percent.
We are all wrong so often that it amazes me that we can have any conviction at all over the direction of things to come. But we must.
We typically hear numbers that there are 34 million households that are in stocks in some form. Well, I say that what's occurred is if you have a job in this country, you're in stocks.
Well, he's just the same guy who in other aspects of his life would be very late to a trend.
What I'm saying is that there are bargains right now, there are stocks right now that if you're shrewd enough, you will be able to buy them at the opening today and I you'll make money in a year from now.
When I speak of the term 'the stock market', I'm invariably speaking of good American companies that tended to be not that sharp in the '70s, got sharp in the '80s, and are now unbelievably good in the '90s.
You have a class of investors and you have a class of speculators. The speculators historically haven't been big enough to cause the investors to doubt the long-term vision of stock.
Jim Cramer Quotes, Mad Money quotes, business quotes
The speculative public is indulged in stocks that I have no confidence in. There's a stock that I am sure of right now, Iomega, that is the third-tier player in a very cyclical market, storage for personal computers.
The third-tier players, Iomega, IMP, historically in this era when PC sales are threatened if there's a lot of competition in storage, the third-tier players usually cease to exist in six to eight months.
The way the credit cards were made in the '80s to be a people's form of capitalism and be able to make it so that you could get a loan that you would have been denied previous, now that's the way stocks are.
Their managements are not as shrewd and Hewlett-Packard. They're not as good as a management of Intel. They haven't seen downturns like the management of Merck.
There are companies out there in our country who historically have not been able to beat the Germans and the Japanese, who now beat them routinely.
There are tons of people who are late to trends by nature and adopt a trend after it's no longer in fashion. They exist in mutual funds. They exist in clothes. They exist in cars. They exist in lifestyles.
There were speculators saying that the foreign stocks had the stock going down. They were all wrong. Those classes of assets were dangerous at the time and they became great bargains.
There's accountability in the mutual fund industry. And they've been tremendous engines of wealth for people and they're going to continue to be so.
There've been fortunes made in Merck. There have been fortunes made in Pfizer. There will be fortunes again made in Merck and Pfizer.
These will be fabulous investments and will make millions of more people rich.
They had too many country clubs, too many airplanes, whatever. And raiders came in and rationalized those and then the raiders got too greedy and the raiders blew off. Good riddance.
This issue has died down right now because the way the corporate killers were on the cover of Newsweek and everybody's been hushed about the lay-offs.
Those were the people who sold were people who had chased previously good performance in '93. Now we have seen those funds suffer massive redemptions, at times being down as much as 40-50 percent.
We are all wrong so often that it amazes me that we can have any conviction at all over the direction of things to come. But we must.
We typically hear numbers that there are 34 million households that are in stocks in some form. Well, I say that what's occurred is if you have a job in this country, you're in stocks.
Well, he's just the same guy who in other aspects of his life would be very late to a trend.
What I'm saying is that there are bargains right now, there are stocks right now that if you're shrewd enough, you will be able to buy them at the opening today and I you'll make money in a year from now.
When I speak of the term 'the stock market', I'm invariably speaking of good American companies that tended to be not that sharp in the '70s, got sharp in the '80s, and are now unbelievably good in the '90s.
You have a class of investors and you have a class of speculators. The speculators historically haven't been big enough to cause the investors to doubt the long-term vision of stock.
Jim Cramer Quotes, Mad Money quotes, business quotes
Monday, August 21, 2006
ETF trading like the pros
Sometime when investing, and especially with something such as an ETF fund which is very broad, low risk, and pretty safe investment. Sometimes thinking outside the box is a pro thing to do. Thinking of different markets or sects that you feel have strengths. Don't always fall for investing into a ETF with what seems hot right now such as the REIT's or energy. Think outside the box a little and look down the road and what will be hot from 3 to 6 months from now? Okay no one can really predict this, but you can be pretty safe with an EFT so stretch it a little bit!
Look into actual values and what is undervalued in today's market could be a steal down the road or long term. This would be a great steal to get into a EFT. This is what the pros do, they don't just wait there time at looking or analysting and identifying the true stock value and if it's a fair enough stock value to have to date.
We can not say enough about fundamental and stock analysts research and evaluation could save you not only a lot of money, but probably a lot of time in the long run. Look and research what the ETF's are trading, the history holds, and always check the growth rate.
Remember there are several companies out there for the ETF index fund. So that means competition, but competition can be healthy. So what is our point...our point is sometimes going with the other guy that is or could be offer the same ETF for a lower price then why not go for it! Sometimes the big guys can hurt you in the long run...becuase of them want to make money too. But, sometimes those big guys make money off you more then you could believe!
Always remember as well, that investing is long term. If your looking for a quick buck first you will not be getting them out of any ETF's. So research, check into a lot of different things, and pick the one that you think can make a good long term return and start trading smart like a pro!
Look into actual values and what is undervalued in today's market could be a steal down the road or long term. This would be a great steal to get into a EFT. This is what the pros do, they don't just wait there time at looking or analysting and identifying the true stock value and if it's a fair enough stock value to have to date.
We can not say enough about fundamental and stock analysts research and evaluation could save you not only a lot of money, but probably a lot of time in the long run. Look and research what the ETF's are trading, the history holds, and always check the growth rate.
Remember there are several companies out there for the ETF index fund. So that means competition, but competition can be healthy. So what is our point...our point is sometimes going with the other guy that is or could be offer the same ETF for a lower price then why not go for it! Sometimes the big guys can hurt you in the long run...becuase of them want to make money too. But, sometimes those big guys make money off you more then you could believe!
Always remember as well, that investing is long term. If your looking for a quick buck first you will not be getting them out of any ETF's. So research, check into a lot of different things, and pick the one that you think can make a good long term return and start trading smart like a pro!
Thursday, July 06, 2006
Global Warming and why we need more solar power and other alternative-energy stocks
Global Warming
Do you believe or buy into this one? Well, while you will honestly not be seeing and major effects immediately. Though we believe that this is happening and that it could have some long term effects with will hit home in time. Which time will only tell us.
Nature can be gruel. With global warming the world's glaciers are melting faster than ever before. This is increasing the water supply for the 40% of the worlds population that rely on glacial melt for their water supply. Then, the glaciers will be gone and with them, the water supply for over 2 billion people. But we won't have the energy required to build and run desalination (remove the excess salt and other minerals from water in order to obtain fresh water) plants to deliver potable water to that many people, because the world will not be able to increase energy production at will, it will have lacked that ability for many years.
Interested in some facts here check these interesting articles, and tell us what you think!
2005 Was The Warmest Year In A Century
Global Warming Surpassed Natural Cycles In Fueling 2005 Hurricane Season, NCAR Scientists Conclude
We had to throw this one in as well...The good, bad and ugly of world growth
This is why we need more solar power and other alternative-energy stocks seem to us to be more appealing and have a bright future just like Jim Cramer! Booyah! So check out one of past articles about solar power and other alternative-energy stocks.
Sun Kissed
Solar-power and other alternative-energy stocks suddenly appear to have a bright future. Even W. is warming up to them.
By James J. Cramer
Do you believe or buy into this one? Well, while you will honestly not be seeing and major effects immediately. Though we believe that this is happening and that it could have some long term effects with will hit home in time. Which time will only tell us.
Nature can be gruel. With global warming the world's glaciers are melting faster than ever before. This is increasing the water supply for the 40% of the worlds population that rely on glacial melt for their water supply. Then, the glaciers will be gone and with them, the water supply for over 2 billion people. But we won't have the energy required to build and run desalination (remove the excess salt and other minerals from water in order to obtain fresh water) plants to deliver potable water to that many people, because the world will not be able to increase energy production at will, it will have lacked that ability for many years.
Interested in some facts here check these interesting articles, and tell us what you think!
2005 Was The Warmest Year In A Century
Global Warming Surpassed Natural Cycles In Fueling 2005 Hurricane Season, NCAR Scientists Conclude
We had to throw this one in as well...The good, bad and ugly of world growth
This is why we need more solar power and other alternative-energy stocks seem to us to be more appealing and have a bright future just like Jim Cramer! Booyah! So check out one of past articles about solar power and other alternative-energy stocks.
Sun Kissed
Solar-power and other alternative-energy stocks suddenly appear to have a bright future. Even W. is warming up to them.
By James J. Cramer
Cramer, Jim Cramer, Cramer Mad Money!
Here is a new one for you and myself, but it's going on. We are calling it the Cramer report and that's right it's all about the Cramer report. Cramer report is very entertaining and he is drawing a great fan base or even close to a bandwagon that continue to turn into his Cramer TV Mad Money! Cramer with all his rants about business and investing during Mad Money, it's like ESPN hits the stock market so BOOYAH!
Though, Cramer, Mad Money, the street, Cramer's Blog all that is honestly is great. Cramer is a very smart man, and the fact of the matter is...Cramer is a genius! There is one thing that what we would like to talk about today. This would be what we are calling the cramer bandwagons. These are the average joe trader sitting on the couch yelling booyah right along with Cramer throughout the whole show. Some of these same people are traders that could take every little thing that Cramer says rather it's entertaining or serious they are taking it all in as stock information to the very last booyah Cramer says! But, the fact of the matter is they are not stopping there. They will then run to there computer and get on yahoo stock discussion boards, stock forums, and etc and will continue to repeat everything that Cramer stated rather it was a joke or not.
So, your probably asking yourself so what...everyone had there opinion which is fine and great and dandy! Even Cramer has his strong and funny opinions as well. Though, the fact of the matter is people on this Cramer bandwagon are taking his word and turning into gold or even better investing. Investing is not rocket science we know this, but it's not always that easy as well.
Though, here is a new Cramer bandwagon theory that seems to be sort of trend of and in of it's self. The Cramer bandwagon strategy is go buy the stock that Cramer picks, and it should be going up. Why, because Cramer has these bandwagon fans that will take everything that he has to say and will start discussing them and even buying into his stock suggestions!
Well, to conclude, keep tuning into Mad Money, reading Cramer's log, the cramer report, and etc. We know for sure we will. It's a great resource for new stock ideas, and his introductions to be loaded with great information. Though, remember to do your own homework, listen with one ear while read and research with two eyes, and then you will be the true booyah stock winner! And Remember...Picks that stick. Stocks that rock. Equities sans inequities. Money without the madness. Booyah!
Though, Cramer, Mad Money, the street, Cramer's Blog all that is honestly is great. Cramer is a very smart man, and the fact of the matter is...Cramer is a genius! There is one thing that what we would like to talk about today. This would be what we are calling the cramer bandwagons. These are the average joe trader sitting on the couch yelling booyah right along with Cramer throughout the whole show. Some of these same people are traders that could take every little thing that Cramer says rather it's entertaining or serious they are taking it all in as stock information to the very last booyah Cramer says! But, the fact of the matter is they are not stopping there. They will then run to there computer and get on yahoo stock discussion boards, stock forums, and etc and will continue to repeat everything that Cramer stated rather it was a joke or not.
So, your probably asking yourself so what...everyone had there opinion which is fine and great and dandy! Even Cramer has his strong and funny opinions as well. Though, the fact of the matter is people on this Cramer bandwagon are taking his word and turning into gold or even better investing. Investing is not rocket science we know this, but it's not always that easy as well.
Though, here is a new Cramer bandwagon theory that seems to be sort of trend of and in of it's self. The Cramer bandwagon strategy is go buy the stock that Cramer picks, and it should be going up. Why, because Cramer has these bandwagon fans that will take everything that he has to say and will start discussing them and even buying into his stock suggestions!
Well, to conclude, keep tuning into Mad Money, reading Cramer's log, the cramer report, and etc. We know for sure we will. It's a great resource for new stock ideas, and his introductions to be loaded with great information. Though, remember to do your own homework, listen with one ear while read and research with two eyes, and then you will be the true booyah stock winner! And Remember...Picks that stick. Stocks that rock. Equities sans inequities. Money without the madness. Booyah!
Wednesday, July 05, 2006
Have you ever wondered why some say buy and other say sell?
Have you ever wondered why some say buy and other say sell? Seriously why is it that some analysts recommend some stocks but not others? Let us do some research and work for you to help completely explaing this very great investing question. The simple, quick, and easy answer is intrinsic value of a company. Now, I know what your thinking what in the world is this intrinsic value of a company. Well let us break it down to an average trader joe. Though using the intrinsic value, analysts are able to predict what the target price for a stock should be. And your asking well who cares about the target price of a stock or what it should be. Well, if your investing money into a stock you should care!
The target price for a stock is found by taking the market cap (the price of the stock multiplied by the number of outstanding shares) and the intrinsic value and putting them into the following formula: -((market cap-intrinsic value)/intrinsic) x 100. This formula gives the percentage of whether the company is overvalued or undervalued. This percentage is then taken and multiplied by the current stock price to get the target price. For example, if a company is trading at $50 a share, and is undervalued by 15% to find the target price, you would use the following formula: 50 x 1.15=57.5 or Current Stock Price times percent difference + current stock price= target price.
The target price for a stock is found by taking the market cap (the price of the stock multiplied by the number of outstanding shares) and the intrinsic value and putting them into the following formula: -((market cap-intrinsic value)/intrinsic) x 100. This formula gives the percentage of whether the company is overvalued or undervalued. This percentage is then taken and multiplied by the current stock price to get the target price. For example, if a company is trading at $50 a share, and is undervalued by 15% to find the target price, you would use the following formula: 50 x 1.15=57.5 or Current Stock Price times percent difference + current stock price= target price.
Subscribe to:
Posts (Atom)